background swath

Perspectives

Credit Where it’s Due

shutterstock 131389106

Finding the Right Corporate Bond Allocation with LDI Hibernation

When de-risking with liability driven investing, pension plans must decide on the right blend of corporate bonds and Treasuries to hedge their liabilities. We look at the forces that can drive this decision and find that the mix of hedging bonds depends on changing market conditions. Plans should periodically examine their liability hedging portfolios and be aware of the opportunities and pitfalls presented by changes in the marketplace.

Introduction

“In theory, theory and practice are the same. In practice, they are not.” Since this wisdom seems to apply to nearly every aspect of modern life, it’s no surprise we also find it relevant to liability driven investing (LDI) for pension plans.

In theory, liability hedging sounds easy: just buy bonds. After all, a defined benefit pension liability’s value moves with market forces the same way a bond does – up when rates go down, and down when rates go up. And within the universe of fixed income securities, investment grade corporate bonds1 are often seen as the hedger’s asset of choice, since their yields are used to value the liability on the sponsor’s financial statements and to calculate required funding contributions. Liability driven investing could seem as straightforward as buying corporate securities similar to those used for liability discounting, and expecting pension risk to fall in kind.

In practice, of course, it’s not that simple. A plan’s exposure to equities, the quirks of liability discount curves, the credit quality of bond benchmarks, and the volatility and market environment are among the factors that complicate the decision of how many corporate bonds to put in an LDI program.

In this paper, we will explore six dynamics that plans should consider when designing and maintaining an LDI hedging strategy – a process that often amounts to a tug-of-war between corporate bonds and Treasuries. A key takeaway is that while some of these decision factors are constant, others are not. As the volatility of different aspects of the market change, so too will the appropriate role for different hedging assets. While readers may find much of this material familiar,2 we can all benefit from reacquainting ourselves with these fundamentals. The reality may be messier than the theory – as is often the case – but we can strive to master it just the same.

Credit Check

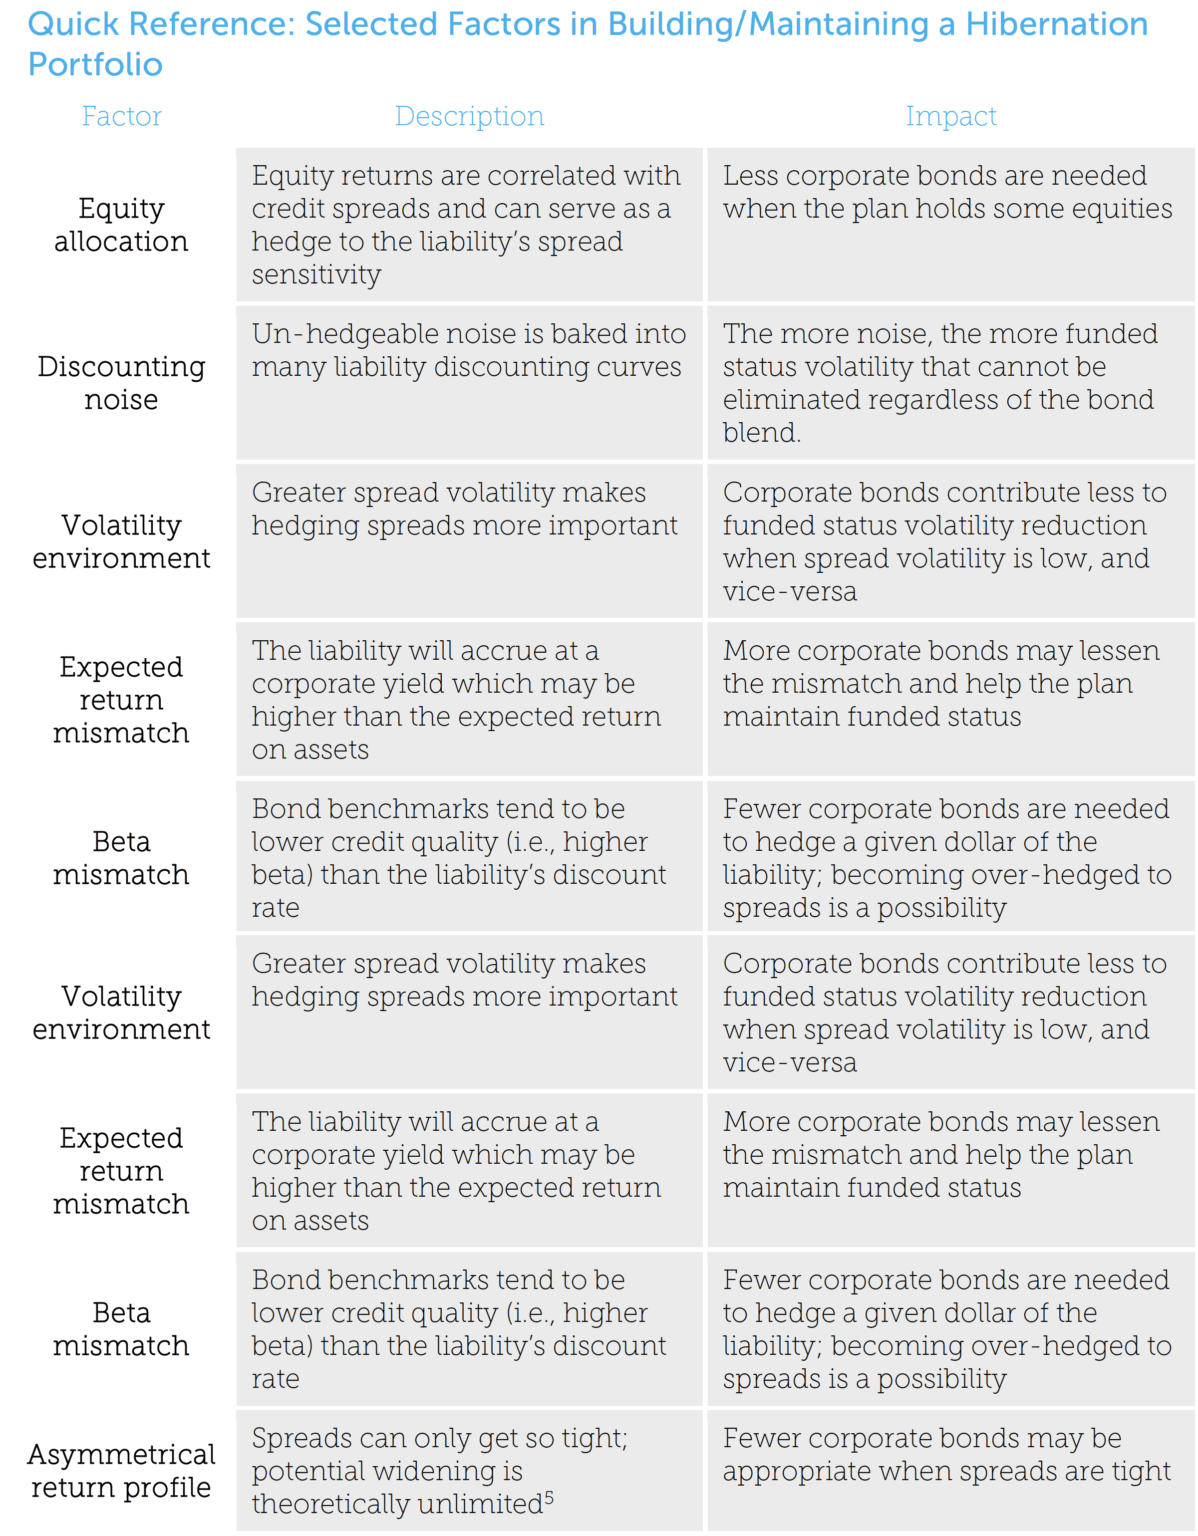
Think of fixed income allocations in a hedging program as a see-saw. More corporate bonds must mean fewer Treasuries if we consider the total dollar allocation to be static. Let’s examine six of the main factors that can affect both the bond blend in a hibernation strategy and the amount of funded status risk that we can expect it to manage.3 This is by no means an exhaustive list, as there can be many other considerations at play.4

First, the plan should consider its allocation to equities. Before equities are part of the calculation, it may look like a plan needs corporate spread exposure to hedge the spread component of the liability’s discount rate – a vote in favor of hedging with corporate bonds. But equity returns are strongly correlated to changes in corporate bond spreads. As a consequence, the plan as a whole may already have more than enough effective spread exposure to hedge that component of the liability, even if the fixed income allocation in isolation would seem under-hedged. All else equal, the more equities held by the plan, the lower its corporate bond allocation needs to be.

A second factor is the noise that becomes embedded in many liability discount curves due to their construction methodology. Sometimes this noise is from the specific rules used by the various methodologies. Examples of this include the inclusion rules applied to the universe of bonds, or the weighting scheme and functional form behind the fitting technique, and so on. Sometimes the noise is the idiosyncratic type that results from having an undiversified pool of bonds at certain segments of the maturity spectrum. In both cases, the result is that a certain amount of funded status volatility is simply unhedgeable or ill-advisable to hedge with a diversified bond portfolio. All this puts boundaries on what is achievable in a hibernation strategy designed against a noisy discount rate.

Another determinant is the volatility environment, or the absolute levels and relationships between the market risk factors that matter most to pensions (usually equities, interest rates, and credit spreads). Intuitively, the more volatile a risk factor, the greater the risk reduction from hedging your exposure to it. In an environment of high credit spread volatility – something we saw at the end of 2008 – holding too little credit could have meant a large amount of prospective pension volatility from unhedged spreads (notwithstanding its positive impact on a plan’s funded status). The opposite would have been true during the low volatility environment of mid-2014. As a consequence, in times of comparatively low volatility, the need to hedge spread risk, and the importance of the credit allocation, is less.

Think of fixed income allocations in a hedging program as a see-saw: More corporate bonds must mean fewer Treasuries.

The potential expected return mismatch between the assets and the liability represents a fourth consideration. The expected return for Treasuries is lower than the corporate bond yields at which the liability will accrue. All else equal this makes Treasuries harder to hold since, unless the plan is overfunded, it will probably be projecting a decline in funded status over time by holding lower-yielding assets. That puts a thumb on the scale in favor of corporates as the hedging asset.

A fifth factor is quality difference, or the beta mismatch between bond benchmarks and liability discount rates. Take a common benchmark such as the Barclays Long Credit, which has a lower average credit rating and therefore a higher spread beta (currently around 1.2) versus the Citigroup Pension Discount Curve. When the spread of the bonds constituting those liability discount curves changes, we expect to see a more amplified change in the lower quality Long Credit index, so that each dollar invested in the Long Credit hedges more than a dollar of the liability’s spread sensitivity. This beta difference means that when the plan has dedicated most or all of its assets towards LDI hibernation, it is probably better off with some amount in Treasuries to not overshoot on spread risk.

The sixth issue is the asymmetrical return profile that credit spreads exhibit in certain markets. When spreads are already tight, there is little room for them to tighten much further but plenty of room for them to widen. In those situations, the plan may take a tactical stance to reduce the corporate bonds it holds and leave a portion of the spread exposure unhedged. Conversely, a plan building its hedging portfolio in an environment of wide spread levels may favor corporate bonds, all else equal, to protect against the risk of spreads tightening.

The Factors in Action

Now that we’ve discussed a few of the major factors in designing an LDI hibernation portfolio, let’s see these factors in action by looking at some data. In the charts below, we look at funded status volatility for three hypothetical plans using the Citi Pension Discount Curve for liability valuation. The first plan has a traditional asset allocation of 60% equities and 40% fixed income, with all the fixed income dedicated to liability hedging. The second and third plans reflect hibernation strategies with 80% and 100% of their assets in fixed income, respectively.

For each of these plans, we show how prospective funded status volatility changes with different bond blends in the hedging/hibernation portfolio. We keep the overall allocation to fixed income constant while looking at how expected funded status volatility rises and falls for different combinations of corporate bonds and Treasuries. Separately, we assume that the plan’s assets always remain duration-neutral to the liability with a derivative hedge, if needed, so it’s never the case that the bond blend is biased towards Treasuries (with longer available durations) as a way to simply hedge interest rate risk.

Lastly, to get a sense of how much the market matters, we show results using data from three representative environments during the last decade: the high volatility environment of year-end 2008, the moderate volatility environment of year-end 2012, and the low volatility environment at halfway through 2014 for an illustrative liability.

A major takeaway from this analysis is that the most effective allocation to credit is not static.
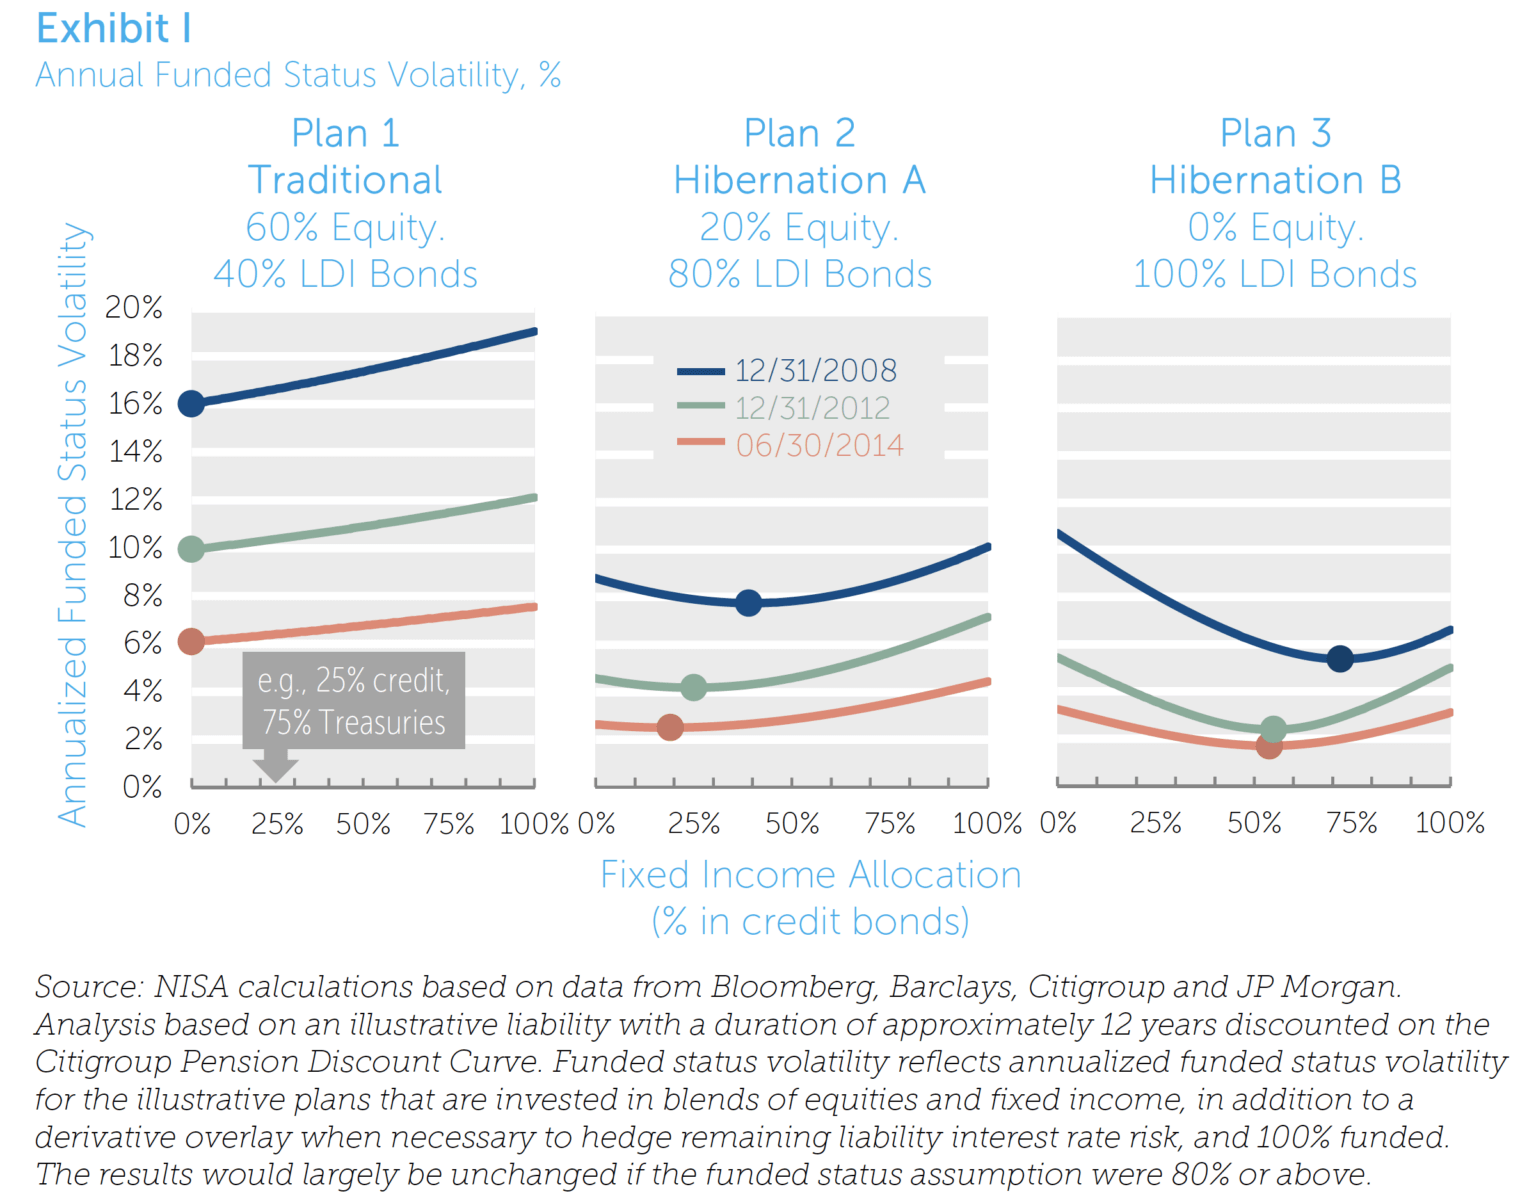
Each line reflects, for a given plan and point in time, the range of funded status volatilities that can be expected for different blends of corporate bonds and Treasuries. The lowest funded status volatility allocation is indicated with a dot (e.g., about 25% credit and 75% Treasuries for Plan 2 in 2012 results in a funded status volatility projection of about 4%).
Exhibit I Annual Funded Status Volatility

From these graphs we can pick out the six factors that we discussed above. We can see the impact of equity allocations by noticing how the funded status minimizing allocation to credit in Plan 1 is zero in all three years, since its equity allocation already hedges (indeed, over-hedges) the liability’s spread component. But by the time we reduce equities to only 20% in the second plan, some allocation to credit may help hedge that spread risk and reduce expected funded status volatility. If the equity portfolio is eliminated entirely as in Plan 3, still more credit is needed to keep funded status volatility as low as possible.

The effect of discounting noise is visible in the fact that no allocation is able to reach the 0% funded status volatility point, even with all assets in the hibernation program. For that
100% fixed income plan, the few remaining percentage points below the optimal allocation reflects the volatility from the noise component that cannot be hedged. As an aside, when the liability is discounted at more economic discount rates (.e.g. Treasuries) with much less noise, this gap can be narrowed significantly.

We can also see the changing volatility environment revealed in these lines. Prospective volatilities of equities, interest rates, and spreads were at a high point at the end of 2008, pushing the blue lines up. They were lower by 2012 and had fallen even further by 2014, bringing funded status volatility down along the way, as seen by the lower green and red lines.

While the absolute level of volatilities drives the altitude of the line, its shape is more a product of the relationship and relative scale of different volatility components. Normally, credit spreads are not expected to be as volatile as general interest rates. But in 2008, credit spread volatility spiked to such an extent that it rivaled that of general rates. That explains the steep slope of Plan 3’s blue line, indicating that getting the right credit allocation was critical at that time to hedge that risk factor. In 2014, however, spread volatility was absolutely low and had also returned to being only a fraction of general interest rate risk volatility. In that context, what resembled a bowl in 2008 looked more like a flat plate in 2014. The flatter this curve, the less the credit/Treasury allocation question mattered, since in either case the bigger risk factor – general interest rates – was hedged.

The best approach is to consider these forces in concert, and assess whether a tune-up is needed as the market conditions and the plan's asset allocation warrant.

We can think of the expected return mismatch along the horizontal axis. The further we move from right to left, (i.e., from more corporate bonds to more Treasuries), the more is given up in expected return. Though the goal of a hibernation program is often to hedge the unexpected changes in funded status, the plan may still want to design the hedging program with long term return expectations in mind. This objective would lead a sponsor to purposely seek a point to the right of the dot, accepting some amount of additional funded status volatility in exchange for higher expected return.

The beta mismatch between bond benchmarks and liability discount curves can be seen in the upward curve of the hibernation lines at the higher credit allocations. Looking at Plan 3, for example, we see that the desired credit allocation in 2014 is about 55%. Adding credit beyond that point actually increases funded status risk as the plan becomes overhedged to credit spreads, even without any spread-correlated equities in the picture. The higher beta of the benchmark bonds is a key part of this upward curvature.

Lastly, while the asymmetrical return profile of corporate spreads is not directly visible in these graphs, we can see it indirectly. Spread volatility and spread level are often correlated, with high spread volatility occurring when spreads are wide, and vice versa. If we assume that relationship holds, then the height and shape of the volatility lines in our charts tells us something about spread levels. The higher and more curved a line for any given plan, the more it reflects an environment of wider spreads, in which we may have a greater incentive to hold credit. The opposite holds true as well, with lower and flatter lines indicating tighter spreads and less desire to hold credit.

A major takeaway from this analysis is that the most effective allocation to credit is not static. The bond blend that best manages funded status risk will shift along with the market and the overall composition of the plan’s assets. Depending on the combination of asset allocation and market factors, the plan should ideally have over 70% of its hedging assets in corporate bonds (Plan 3, 2008), less than 20% (Plan 2, 2014), or want none at all (Plan 1).

There is a more subtle – but equally important – conclusion we can draw from the data: sometimes the blend matters a lot, and sometimes it doesn’t. At the end of 2008, for example, the volatility impact to the 100% hibernation plan of misallocating to credit was substantial. For this plan, getting the credit allocation right meant an expected funded status volatility of about 5%, while getting it wrong meant 11%. But in the low volatility environment of mid-2014, even extreme changes in the credit allocation only moved funded status volatility between about 2% and 3%.

Conclusion

The six forces we outlined in this paper – the presence of equity, discounting noise, volatility environment, return and beta mismatch between the portfolio and its liability, and spread payoff asymmetries – exert different pressures at different times on the allocation to corporate bonds in a hibernated portfolio. Sometimes they reinforce each other, and sometimes they can counteract one another. When designing an LDI hibernation program, the best approach is to consider them in concert, and assess whether a tune-up is needed as the market conditions and the plan’s asset allocation warrant.

Another broad implication is that sometimes the environment affords sponsors the opportunity to deviate more significantly from their strategic targets. For example, if in the middle of 2014 the plan’s view was that spreads were relatively tight and there was less upside than downside to the credit hedge, it would be easier for the plan to decide to underweight credit. Alternatively, for sponsors who had a greater desire for excess return, higher allocations to credit would have borne modest increases in funded status risk. The glass can seem both half empty and half full in those situations.

Above all, the understanding that changing market dynamics can have such a marked effect on the optimal allocation to corporate bonds hammers home an important point about LDI: even for end-state hibernation portfolios, responsiveness to the market landscape is sometimes necessary.

To be sure, the practice of liability driven investing lacks the simplicity of its underpinning theory. To carry it out well, however, we must embrace it completely – warts and all.
Quick Reference Selected Factors in Builiding Maintaining a Hibernation
1. We refer to credit and corporate bonds interchangeably. In other contexts, it’s important to distinguish between corporate bonds and broader credit bond benchmarks, which also include sovereign and supranational debt in addition to companies’ debt.

2. See our earlier paper,
Considerations Surrounding Corporate Bonds in Pension Portfolios, for an analysis of the interplay between discount curves, corporate bond allocations, and funded status volatility.

3. See the table at the end of the paper for a summary of these factors.

4. For example, we don’t address tactical views on interest rates and individual risk-return preferences, among other factors.

5 We ignore the technical possibility of Treasuries containing a default-risk premium greater than that of corporates.
Credit Where it's Due NISA Investment Advisors, LLC

Credit Where it's Due

Download File

Disclaimer: By accepting this material, you acknowledge, understand and accept the following:

This material has been prepared by NISA Investment Advisors, LLC (“NISA”). This material is subject to change without notice. This document is for information and illustrative purposes only. It is not, and should not be regarded as “investment advice” or as a “recommendation” regarding a course of action, including without limitation as those terms are used in any applicable law or regulation. This information is provided with the understanding that with respect to the material provided herein (i) NISA is not acting in a fiduciary or advisory capacity under any contract with you, or any applicable law or regulation, (ii) that you will make your own independent decision with respect to any course of action in connection herewith, as to whether such course of action is appropriate or proper based on your own judgment and your specific circumstances and objectives, (iii) that you are capable of understanding and assessing the merits of a course of action and evaluating investment risks independently, and (iv) to the extent you are acting with respect to an ERISA plan, you are deemed to represent to NISA that you qualify and shall be treated as an independent fiduciary for purposes of applicable regulation. NISA does not purport to and does not, in any fashion, provide tax, accounting, actuarial, recordkeeping, legal, broker/dealer or any related services. You should consult your advisors with respect to these areas and the material presented herein. You may not rely on the material contained herein. NISA shall not have any liability for any damages of any kind whatsoever relating to this material. No part of this document may be reproduced in any manner, in whole or in part, without the written permission of NISA except for your internal use. This material is being provided to you at no cost and any fees paid by you to NISA are solely for the provision of investment management services pursuant to a written agreement. All of the foregoing statements apply regardless of (i) whether you now currently or may in the future become a client of NISA and (ii) the terms contained in any applicable investment management agreement or similar contract between you and NISA.

Agree to Terms

Please review and accept the following to proceed. I have read and agree to the Terms of Use, Disclaimer, PSRX Disclaimer and Privacy Policy. I am either (i) an investment professional and an employee of an institutional investor, or a consultant to an institutional investor, or (ii) an employee of, or a student in, an institution of higher learning and I am involved in the study, research or teaching of subjects related to investments, finance, or economics. I reside in the United States or Canada. I understand that the information is not and should not be regarded as investment advice or as a recommendation regarding a course of action. By clicking “Accept” below, you hereby acknowledge, understand and accept the foregoing.