Regular readers will know we’ve been on somewhat of a campaign against economic disinformation this year, describing how data errors and faulty seasonal adjustments have been sending misleading signals about the true state of the labor market. Alas, we are called into action yet again. Every Thursday brings the release of jobless claims data. Like clockwork, the day also brings numerous headlines and commentary lamenting the still-elevated level of initial claims. While it’s true that, all else equal, we want the initial claims figure to be as low as possible, this figure only tells half of the unemployment story.
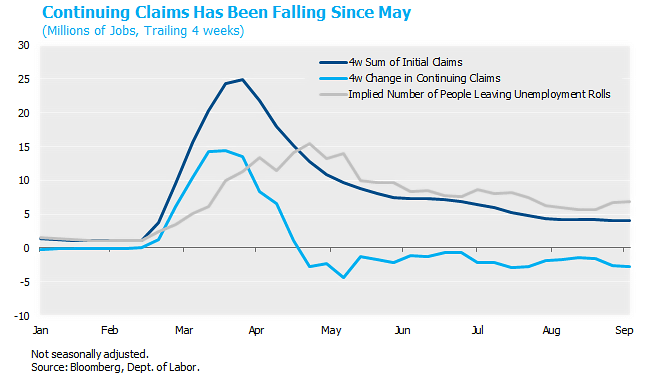
Initial claims represent the flow of newly unemployed workers requesting to be added to the unemployment insurance rolls. There is also a measure of the stock of workers receiving unemployment insurance, namely continuing claims. If you only look at the initial claims data, you would most likely be alarmed to see over 800 thousand people per week applying for benefits on average since August, as that pace is well above the peak of the 2008 recession. But if you look at the continuing claims data, you’ll find that the stock of benefit recipients has been declining by an average of 600 thousand people per week over the same period. Some simple arithmetic therefore tells us that there has been an average gross outflow of 1.4 million people from the unemployment insurance system every week.
Initial claims are the faucet pouring water into the bathtub of unemployment insurance beneficiaries. It’s true that the faucet is wide open, but some people seem to forget that there is also a drain. Let’s focus on the fact that the water level is falling! More workers have been leaving the unemployment insurance system than have been joining it since the labor market recovery took off in May, as shown in the chart below. Like most economic data series in 2020, there is some noise in these figures. A small percentage of initial claims are rejected for ineligibility. State unemployment offices have been overwhelmed by millions of claims, causing delays and data errors (California recently restated their figures and took two weeks off from processing new claims just to work through their backlog). Regulators have warned that fraud may be rampant, thereby inflating initial claims. Though some workers are just starting to exhaust their typical 26 weeks of state benefits and transition to federal pandemic programs, most of the people who have left unemployment since April have done so by regaining employment.

We are living in the most volatile labor market in American history. We’ve shown that unprecedented millions of Americans are shifting every month among employment, unemployment and exiting the labor force. Initial claims are useful as a measure of churn, but they only tell half the story. Assessing the state of the labor market based on initial claims alone is like attempting to value a company based on costs but ignoring revenue. An informed review of the claims data confirms the evidence from other labor market indicators: the economy continues to create more jobs than it destroys. Case in point: last week’s data showed the highest level of weekly initial claims since August 14, but also the largest weekly decline in continuing claims since May.


