Around the office, we have found longevity to be an engaging topic. A conversation about expected lifespans can quickly attract a small gathering of people observing and participating in the dialogue. Why? One answer is that it could be very primal – people are genetically programmed to think about survival, how long they might live, and what factors influence their lifespan. This might be why the conversation inevitably moves to the causes of mortality. Why do different demographics (e.g., blue/white collar, income level, home zip code) seem to have different mortality rates, and what causes those differences? No doubt there is enormous opportunity to confuse correlation with causation in such conversations, but there is another reason the halls of NISA have a natural curiosity about longevity – it is a direct contributor to pension liability risk.
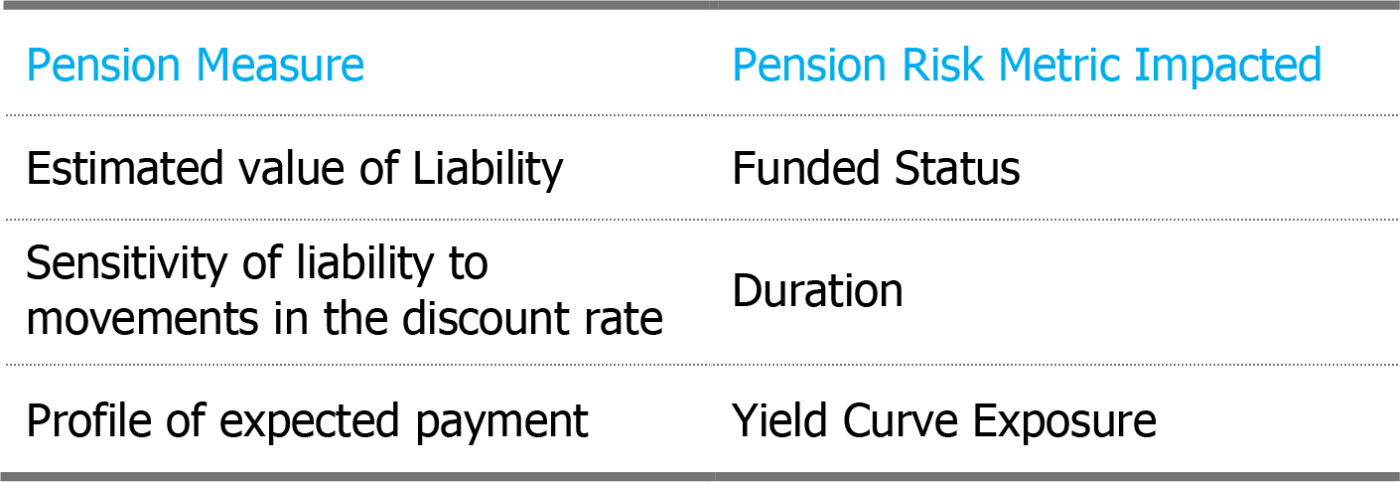
The connection is obvious: how long a retiree lives determines how many benefit checks must be paid. As such, longevity assumptions impact:

To best manage pension risks, it is important to accurately measure all three liability attributes. Research into how estimates of longevity vary across different demographic classifications has revealed a surprisingly large impact on these measures. Lifestyle choices and the social ladder realities of access to health care are drivers of differences in longevity across demographics and the magnitude these differences have on longevity can be quite significant – in the range of 7 to 10 years. This Washington Post article describes some even more dramatic and surprising differences such as two counties in the same state (Virginia) having a life expectancy difference of 14 years!
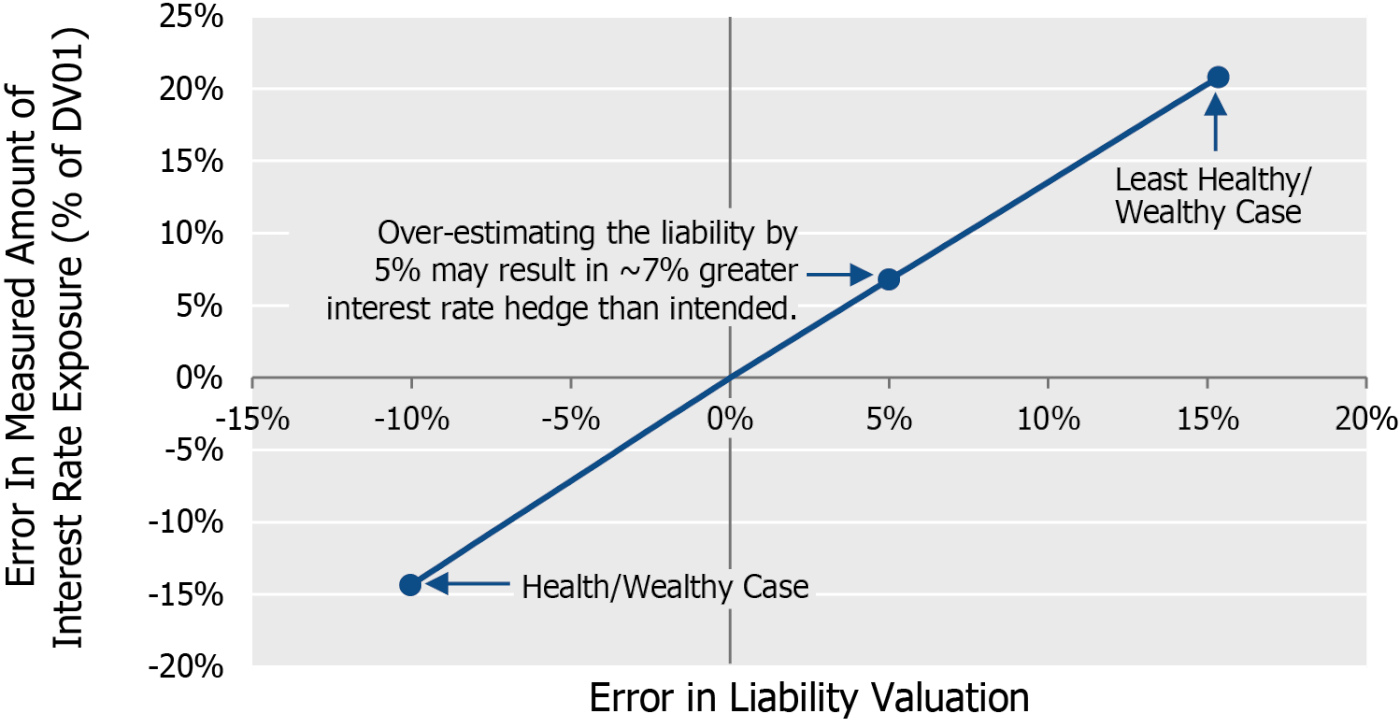
In a recent SOA newsletter article co-authored with ClubVita1, we investigate how different demographic classes can impact liability measures:

The chart above shows that the least healthy/wealthy demographic would be over-valued by ~15% if standard mortality tables were used, while the most healthy/wealthy would be under-valued by ~10%, a swing of 25%! The impact on interest rate sensitivity measures is even larger: The amount of DV01 (dollar sensitivity to a 1bp movement in discount rate) for the least healthy/wealthy would be over-estimated by ~20% by using standard mortality tables, while the most healthy/wealthy would be under-estimated by ~15%, for a full swing of 35%.
We found the size of these differences to be quite surprising, and you may too.
Why does this matter to you?
Standard mortality tables (such as SOA’s Pri-2012) reflect national averages, which may not represent the true demographics of your plan participants. Having a precise estimate based on your plan demographics allows for a better estimate of funded status and allows you to better manage the interest rate risk and yield curves exposures of your liability. Some thought should be given to the appropriateness of standard tables before simply using them by default.
If you are considering a small balance buyout, this sub-group of plan participants is likely associated with shorter longevity than average as they tend to be representative of lower income demographics. Standard mortality assumptions may materially over-value the liability attached to these participants and, accordingly, falsely convey better buyout economics than reality. For a better evaluation, we strongly suggest you revisit the longevity assumptions on this sub-group.
Lastly, if you would like to exchange thoughts on what could be done with your specific plan, we would welcome a conversation. As mentioned, we have a natural affinity to longevity conversations.
1 If you don’t like to read, we also hosted a webinar covering much of the same.


