The ongoing equity rally and the rise in Treasury yields prompted us to revisit this analysis. Between yesterday’s close (December 1) and November 10, when we originally calculated these estimates, the yield of the 30-year Treasury increased 15 bps while the MSCI ACWI climbed 0.3% higher. As a consequence, plan sponsors have likely continued to experience additional funded status gains since the election.
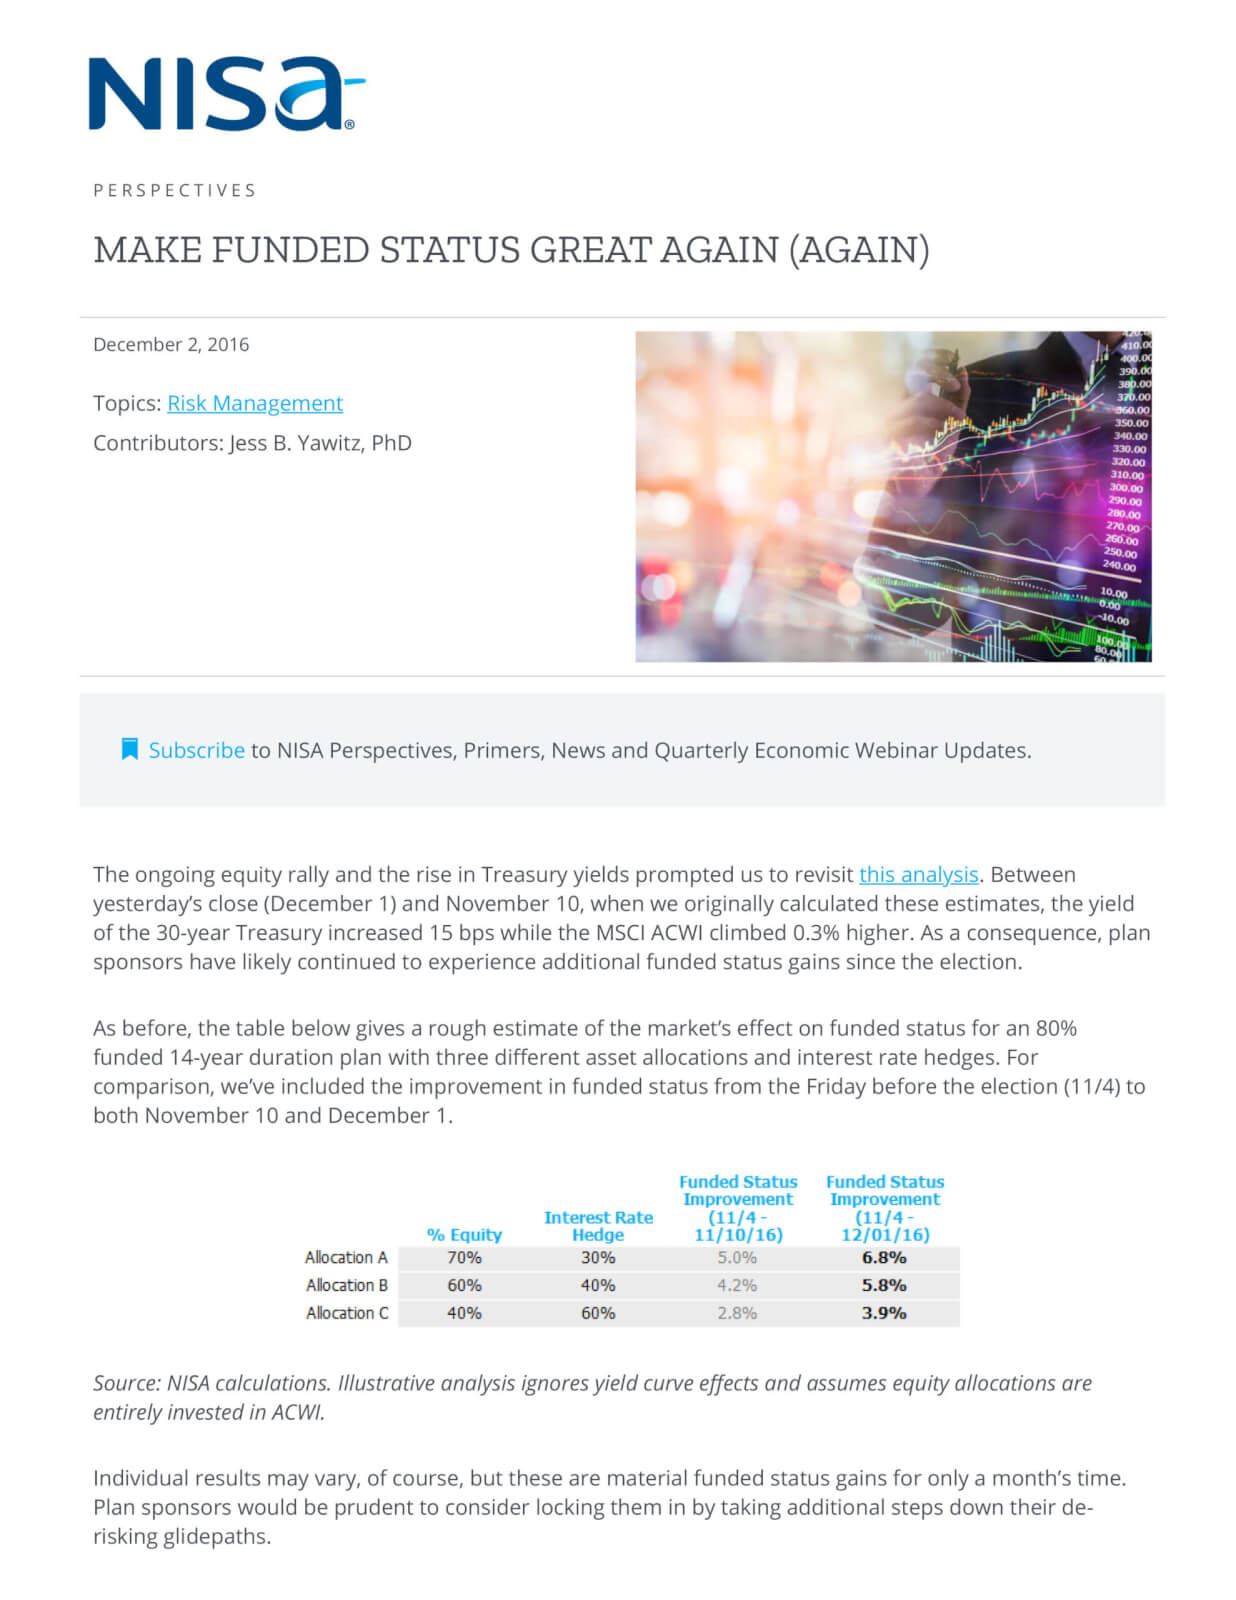
As before, the table below gives a rough estimate of the market’s effect on funded status for an 80% funded 14-year duration plan with three different asset allocations and interest rate hedges. For comparison, we’ve included the improvement in funded status from the Friday before the election (11/4) to both November 10 and December 1.

Source: NISA calculations. Illustrative analysis ignores yield curve effects and assumes equity allocations are entirely invested in ACWI.
Individual results may vary, of course, but these are material funded status gains for only a month’s time. Plan sponsors would be prudent to consider locking them in by taking additional steps down their de-risking glidepaths.


