The U.S. economy suffered from the worst labor shortage in at least six decades during the pandemic. This imbalance peaked in late 2021 with twice as many job openings as unemployed workers and wage inflation running at a four-decade high around 8% annualized. The Fed recognized the severity of the problem (a couple of quarters late, admittedly) and responded with the most aggressive policy tightening in four decades. Restoring balance to the labor market and reducing wage inflation were crucial components of their battle against price inflation.
A Steady Decline in Labor Demand
The Fed’s tools only impact the demand side of the economy, but it should be noted that they received an unexpected assist from the supply side in the last few years as participation rates rebounded after the pandemic and an immigration surge added millions of workers to the labor force. At the same time, monetary tightening has been effective in restraining labor demand. So far, this softening in labor demand has taken the form of a reduction in the number of job openings and the rate of hiring.
Figure 1 presents data from the JOLTS report, excluding the public sector since it is less indicative of underlying labor market trends. The private openings and hires rates peaked at the end of 2021 and have been declining steadily since. While the openings rate has merely normalized back to pre-pandemic levels, the hires rate has fallen through pre-pandemic levels and now sits at its lowest level since 2014.
Figure 1: JOLTS Private Sector Rates
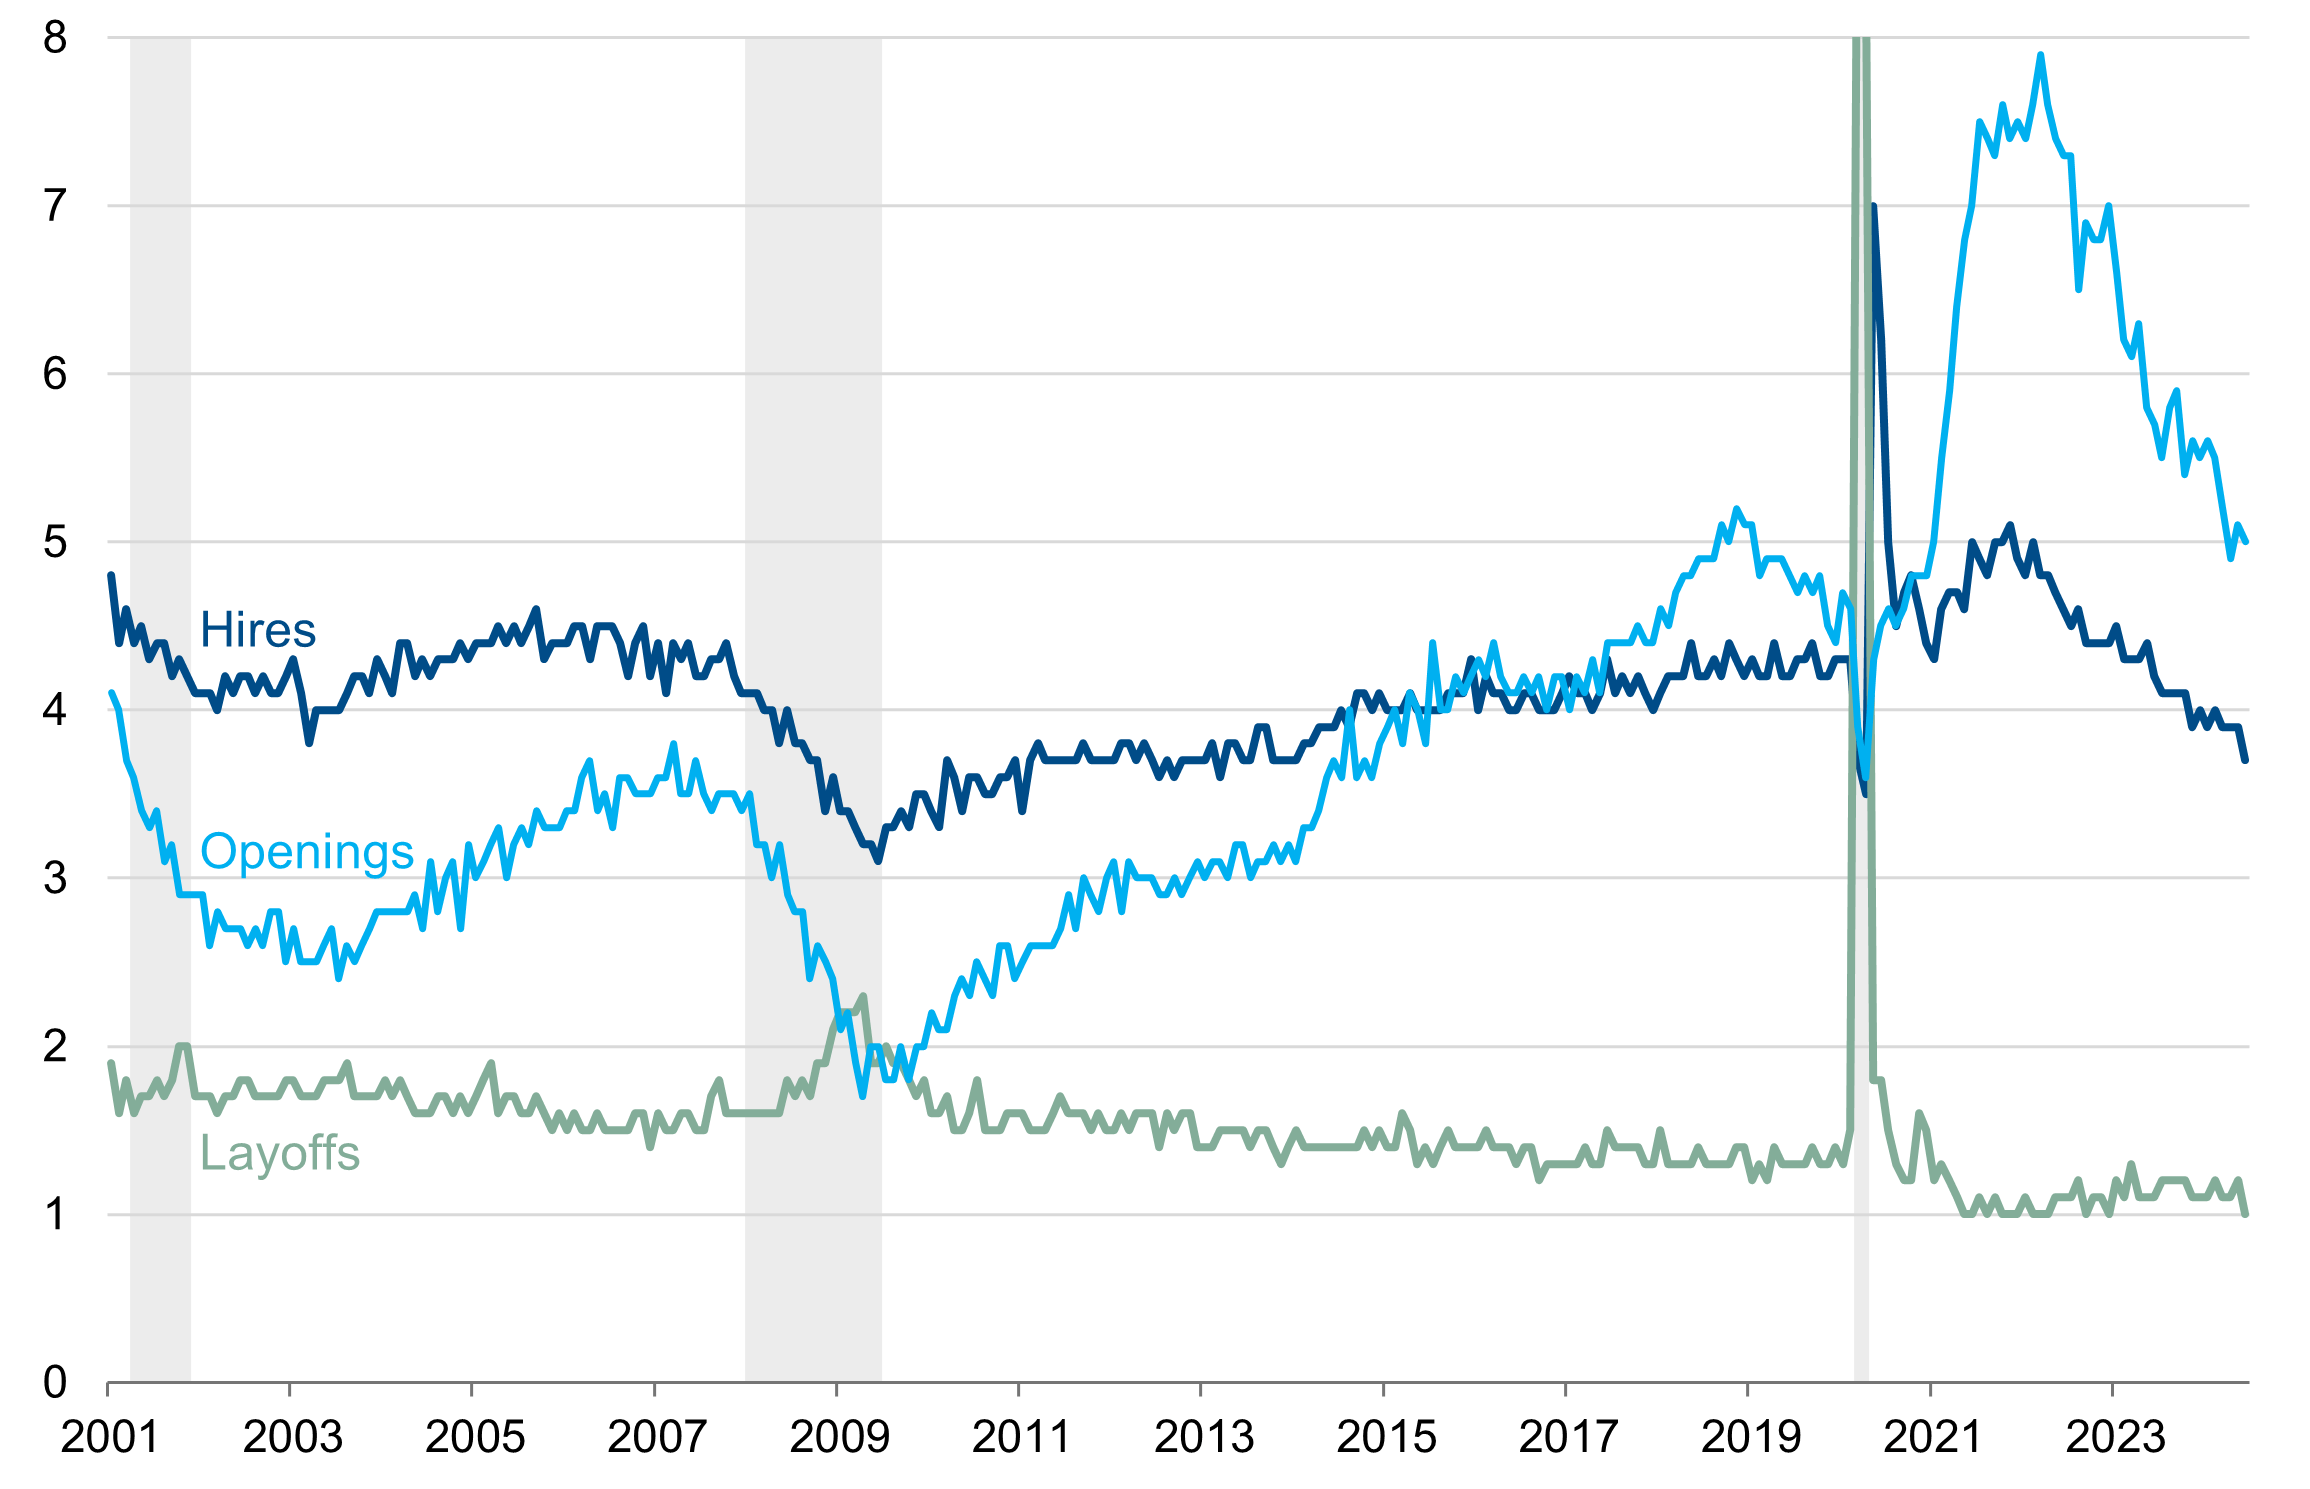
Gray bars indicate recession.
Source: BLS.
The layoffs rate has remained very low. This should not come as a surprise. Layoffs are a last resort for American employers. The history in Figure 1 shows that the layoffs rate has only spiked when the economy was already in the middle of a recession. The fact that the layoffs rate remains low today simply indicates that we are not currently in a recession, but says little about what lies ahead. We have been referring to these JOLTS data as exhibiting pre-recessionary trends. Our concern is that it will be difficult to avoid a recession once the labor market crosses this tipping point from reduced hiring to the more pernicious layoff cycle.
The July Jobs Report Lands with a Thud
The July jobs report (released on August 2) caused a sudden, albeit brief, bout of cross-market volatility as market participants reconsidered recession risk. The 0.2% increase in the unemployment rate, and consequent triggering of the Sahm Rule, seemed to garner the most attention. While the unemployment rate had been rising gradually for more than a year, the current instance might not be as troubling as past episodes since it is caused in part by the surge in labor supply referenced above.
Detailed Labor Force Flows Show the Tipping Point
We were more interested in a lesser-known component of the July jobs report. The labor force flows data track individual respondents to the household survey from one month to the next to monitor how workers are transitioning between different states of employment. The household survey categorizes every American into one of three categories: employed, unemployed, or not in the labor force (NILF). Figure 2 shows these labor force flows between the months of June and July of this year. “Flow” can be a bit of a misnomer as the vast majority of Americans did not change their labor force status in July. The diagonal of the matrix shows that the status for most people does not change in a given month: 155 million people were employed in both months; 94 million were not in the labor force in both months.
Figure 2: Labor Force Flows – July 2024 (Millions)
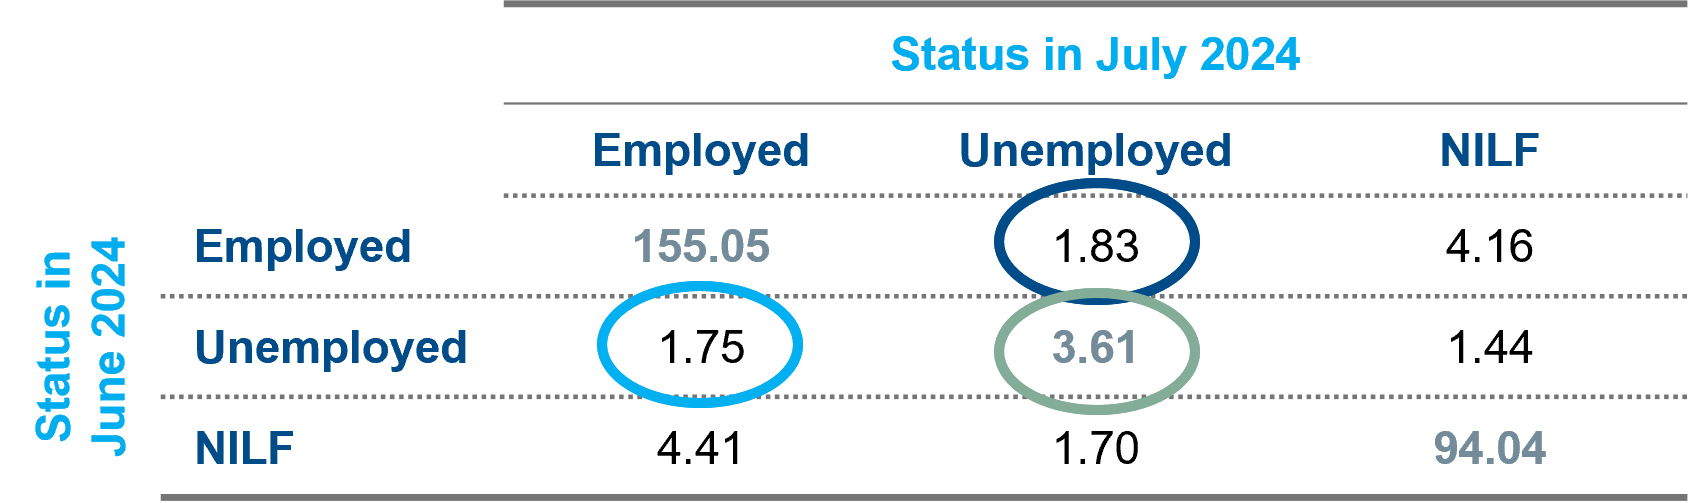
Source: BLS.
The flows between the various categories tell the more interesting story of change and help explain why the unemployment rate has risen since last year. Figure 3 presents the time series for the three flows circled in Figure 2. As you can see, the number of workers stuck in unemployment from one month to the next (the U-to-U flow) has increased from 2.8 million in July 2023 to 3.6 million in July 2024. The flow from employment to unemployment (E-to-U, which primarily represents job separation from layoffs or quits) has not demonstrated a sustained increase. This pattern is consistent with the JOLTS data: the stock of unemployed workers is rising because more people are getting stuck in unemployment as jobs become harder to find; not because of a surge in layoffs.
Figure 3: Labor Force Flows (Millions)
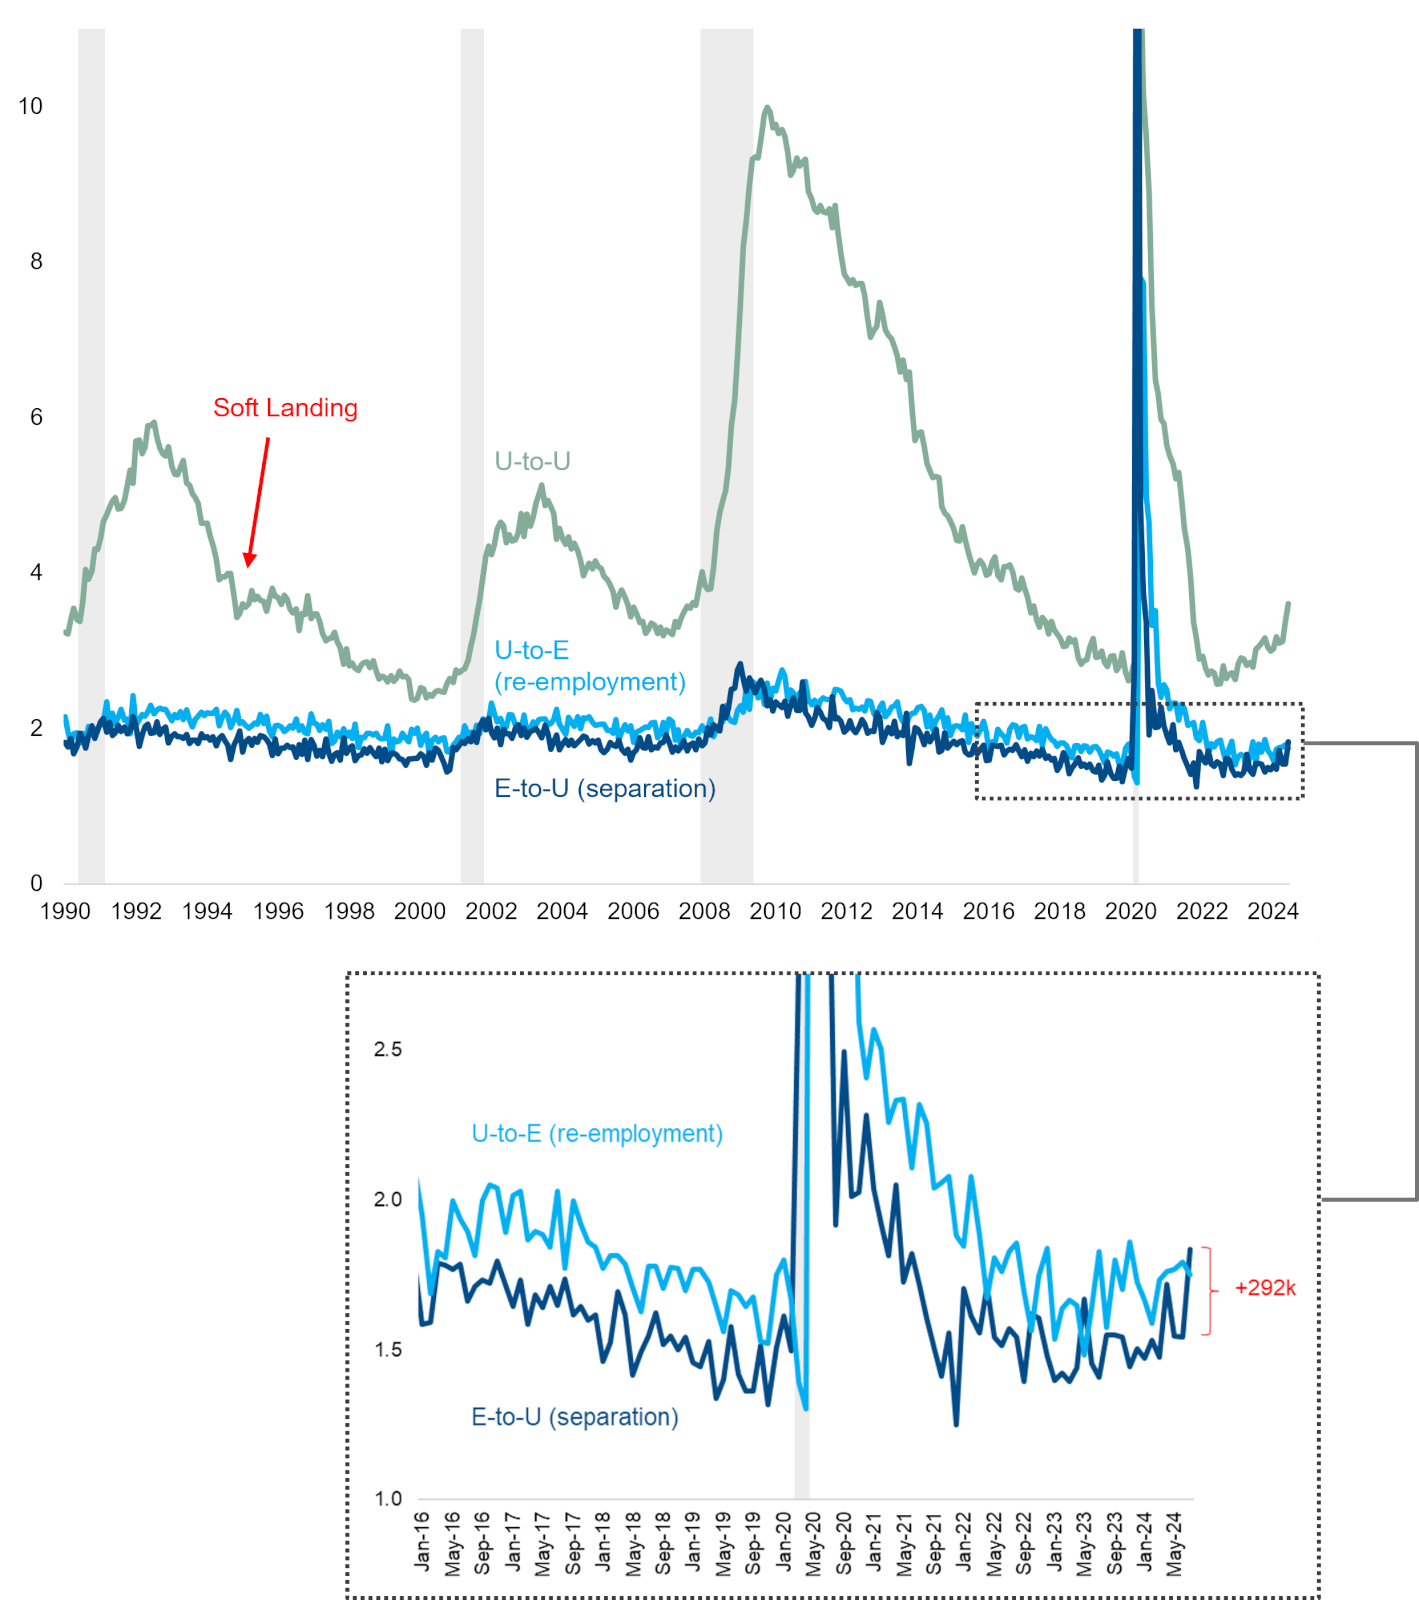
Gray bars indicate recession.
Source: BLS.
Once again, this dynamic appears similar to what was observed prior to previous recessions. The U-to-U flow bottomed about 12 months before the start of the 2001 and 2008 recessions. By the time the E-to-U flows rose sharply, those prior recessions were already underway. Because the flows data only commence in 1990, we can’t say much about the period before the 1991 recession. But this history does allow us to observe labor market dynamics during the 1995 soft landing (the only soft landing in postwar history in our opinion). U-to-U flows increased only slightly after the 1994 monetary tightening cycle, nothing like the large and convincing upswing currently underway. What we are seeing today is a pre-recessionary trend that must stop if we are going to achieve a soft landing.
Finally, if we use our magnifying glass to zoom in on Figure 3, we can see that the E-to-U flow rose by 292,000 people in July. This is only one month of data in a fairly noisy series, but it is a new cycle high, and it does take the E-to-U flow above the U-to-E flow for this single month. In other words: 84,000 more people separated from employment than regained employment in the month of July. This rarely happens for any sustained period of time, even during recessions. You can see this pattern in Figure 4, which shows the difference between these two labor force flows, in three-month moving average terms to smooth out the noise. The only time the E-to-U flow rose above the U-to-E flow on a sustained basis was during the 2008 recession, the deepest in American history since the Depression. If the E-to-U flow continues to climb in the coming months, and even worse if it remains above the U-to-E flow, then we will likely be able to conclude that we have entered a recession.
Figure 4: U-to-E Flow Minus E-to-U Flow (Thousands)
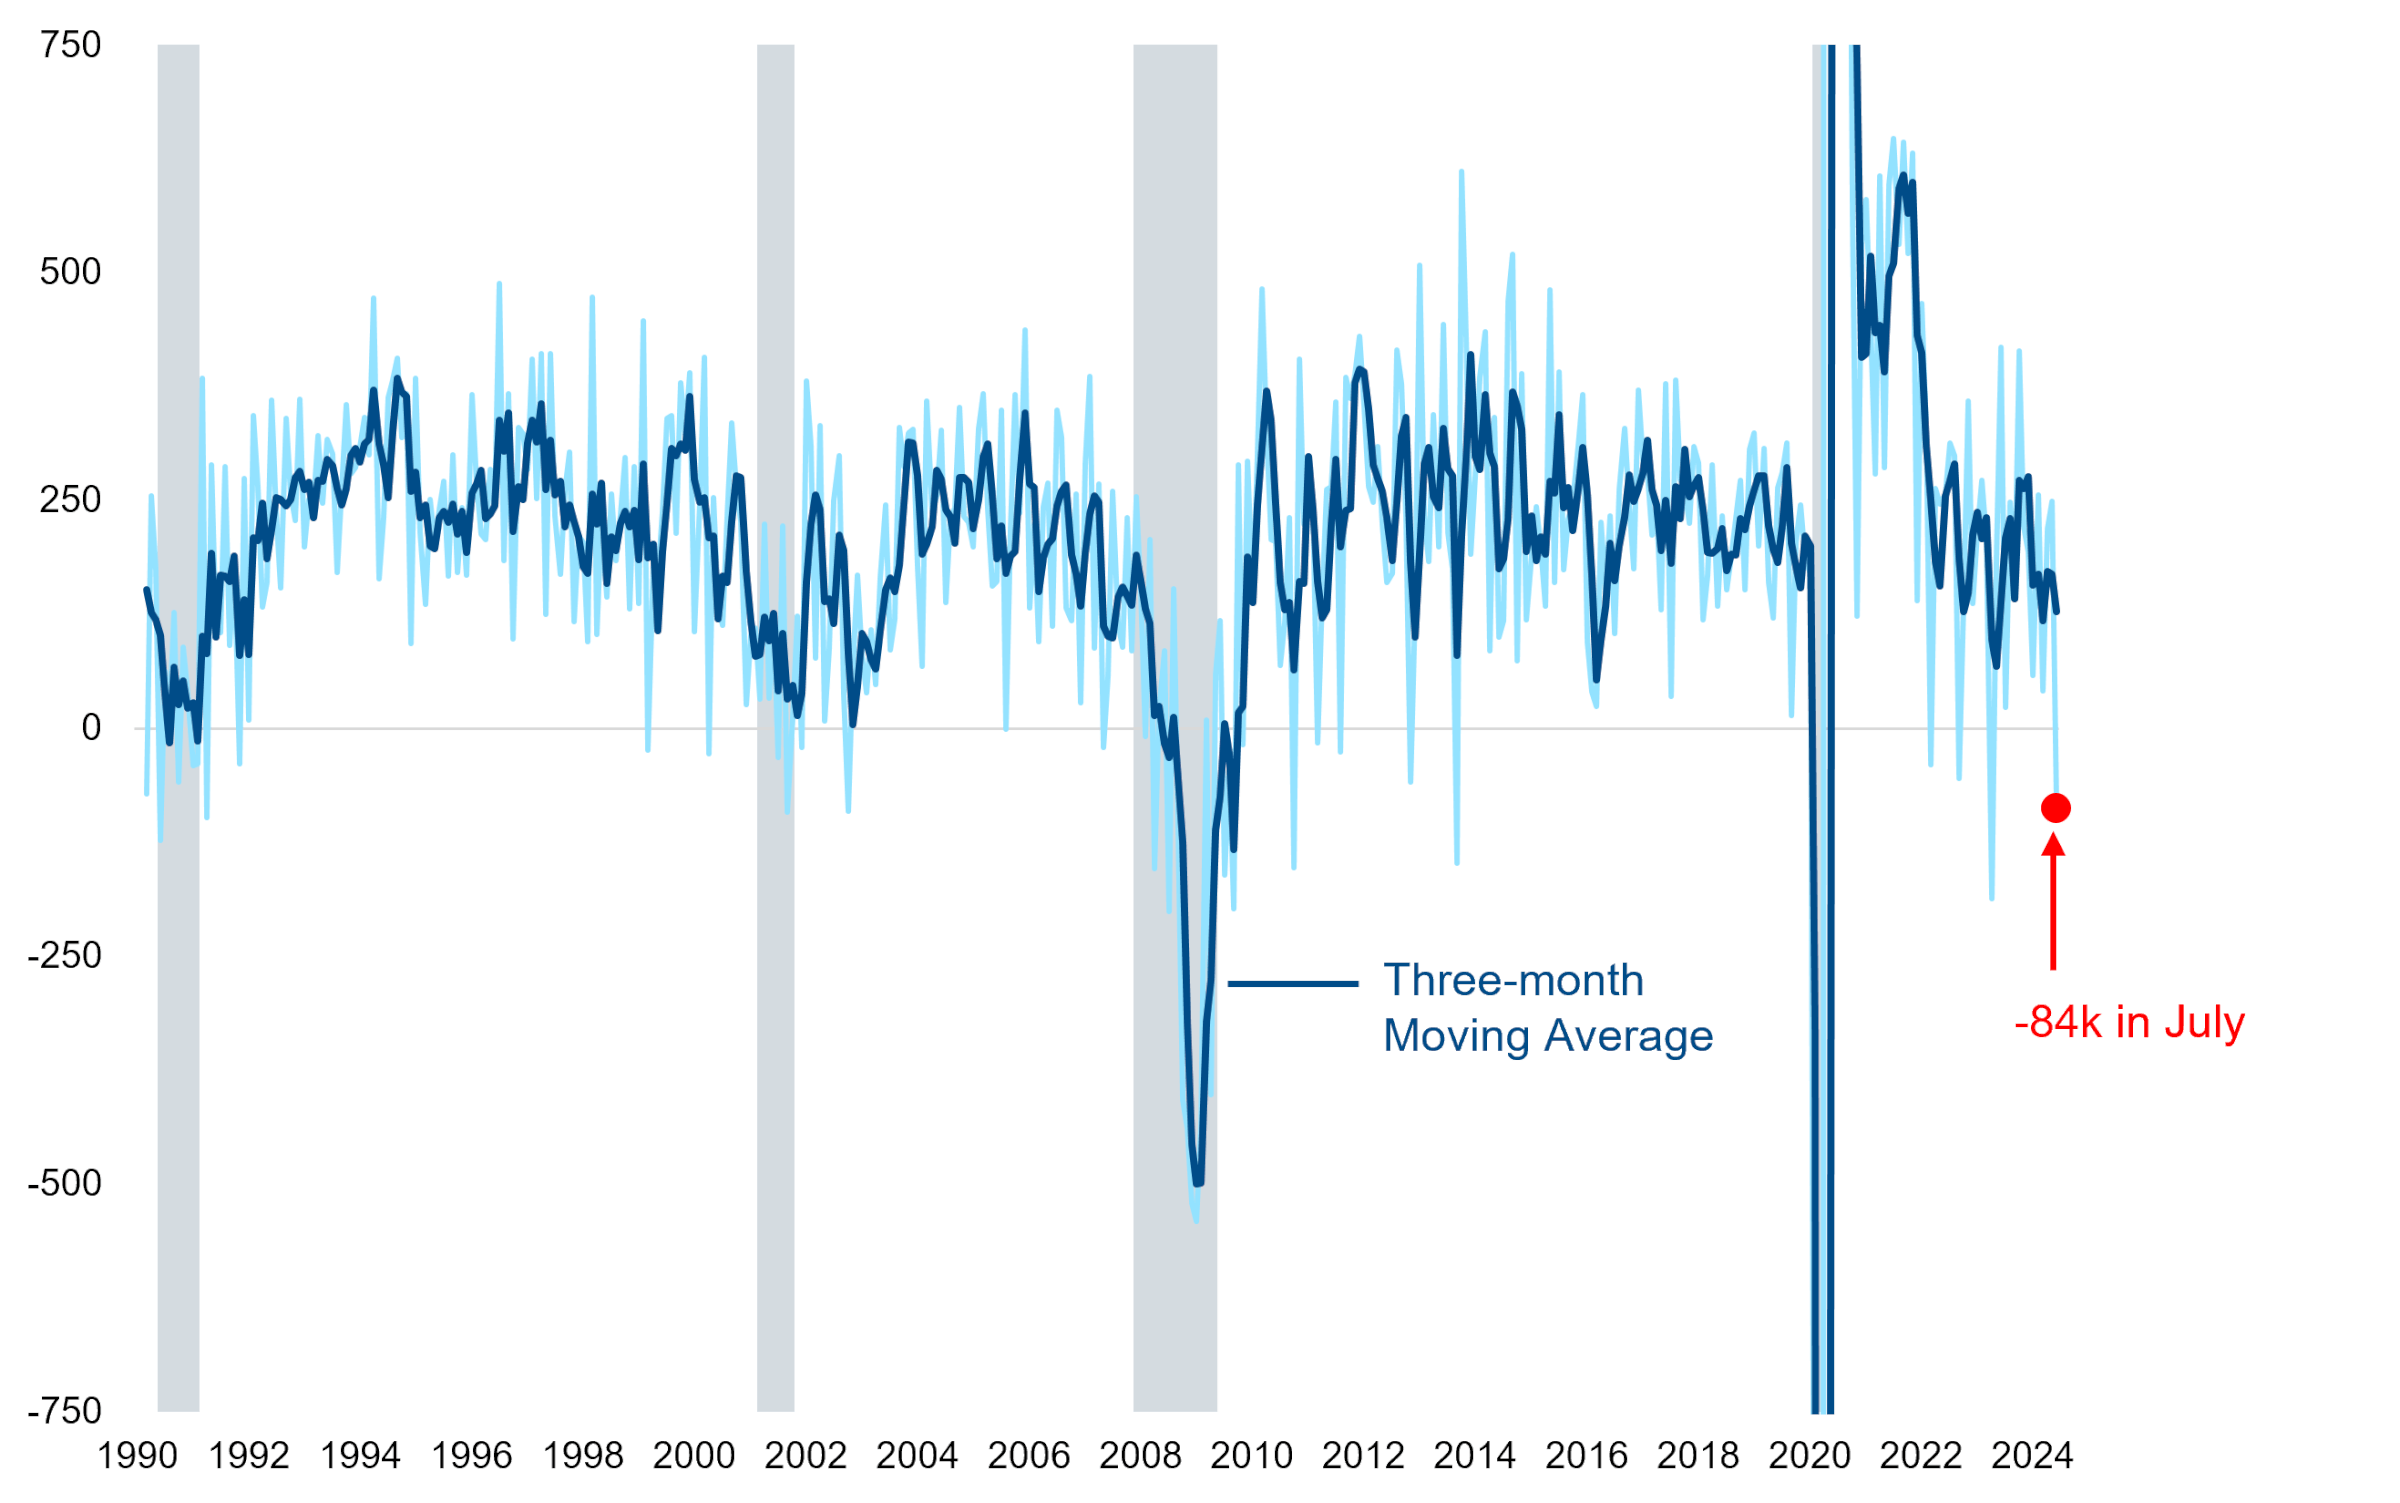
Gray bars indicate recession.
Source: BLS.
Our Fate is Not Sealed
We are not in a recession today, and that fate is not a foregone conclusion. We should also remind readers that if a recession arrives, we expect it to be mild primarily because private sector balance sheets are in relatively good shape. While reduced hiring and rising unemployment look like pre-recessionary trends to us, we are still on the good side of the tipping point. There is still a path to a soft landing. Unfortunately, by the time we cross the tipping point into the layoff cycle, it is probably too late to avoid a recession. Chairman Powell’s Jackson Hole speech made clear that he is well aware of this risk and intends to cut rates aggressively should it materialize (appropriately so). We hope the labor market will continue to keep its balance, but we’ll be watching very closely for any wobbles in the weeks and months ahead.