This has been a frequent question from clients in the past week as the spike in cross-asset volatility sent Treasury yields plunging to record lows. The shortest and most accurate answer is: nobody knows. Just as nobody could have predicted that a novel strain of an otherwise common virus would be the catalyst, or that an ascendant Saudi Arabian prince would start an oil price war with a Russian despot. These are both examples of the inherent difficulty of predicting the direction of interest rates. This difficulty underpins our longstanding support for the strategic decision by plan sponsors to hedge the interest rate risk embedded in their liabilities.
Leaving aside theoretical debates about the storage cost of cash or the value of FDIC insurance, the practical question of a lower bound in Treasury yields depends in large part on monetary policy. Whenever the next recession arrives, we expect the Fed will quickly cut the federal funds rate to zero, provide forward guidance promising to stay at zero for an extended period, then commence a large quantitative easing (QE) program. Interest rate markets are currently pricing the Fed to cut to zero by June, and rising expectations for QE have most likely contributed to the decline in longer-term yields this month.
The weighted average yield of the Bloomberg Barclays Treasury index reached an all-time low of 0.58% on March 9th. The previous low of 0.75% occurred on July 24, 2012, at a time when the Fed had promised to keep the overnight rate at zero for a two-year period and signaled the imminent announcement of QE3. As the effective federal funds rate traded around 10 bps that summer, Treasury yields from the 1-month bill out to the 3-year note fell below 50 bps and stayed there until Chairman Bernanke’s famous communication mishap kicked off the taper tantrum in May 2013.
When the Fed cut to zero in December 2008, the concept of negative rates was inconceivable. Because the market was convinced the Fed’s next move would be an increase, the 2-year Treasury yield remained above the federal funds rate, and therefore above zero, throughout this episode. In 2014, European Central Bank ushered in a new era of central banking by cutting their policy rate below zero. The Bank of Japan followed suit two years later. Today, the ECB policy rate is -50 bps and market participants expect further rate cuts as well as an expansion of QE. The German sovereign yield curve is inverted from that overnight rate down to -100 bps at the 3-year tenor, then upward sloping back to around -50 bps at the 30-year tenor.
The Fed has very publicly stated their opposition to negative interest rate policy. How could they say anything else? If the economy deteriorates after the Fed reaches zero, we anticipate that interest rate markets will come to doubt the Fed’s conviction. If market participants believe a cut is more likely than a hike at that time, the yield curve will likely be inverted from the overnight rate out to the 2-year or 3-year tenor. More aggressive forward guidance or QE could extend that inversion further out the yield curve.
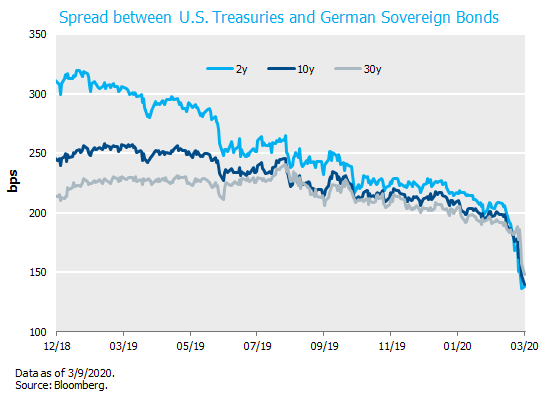
In other words, the Treasury yield curve could end up looking a lot more like the Bund curve. This is no longer an academic exercise. After the collapse in Treasury yields in the last week, the spread between Treasuries and Bunds has narrowed to about 150 bps across the curve, from 200-300 bps last year, as shown in the figure below. It remains to be seen whether coronavirus fears will produce a severe recession and cause that spread to collapse further, or fade away and cause Treasury yields to rise back to last year’s levels. In a forthcoming Perspectives post, we will consider the pension risk associated with these large fluctuations in interest rates.


