
Economic and Market Overview
March 2026
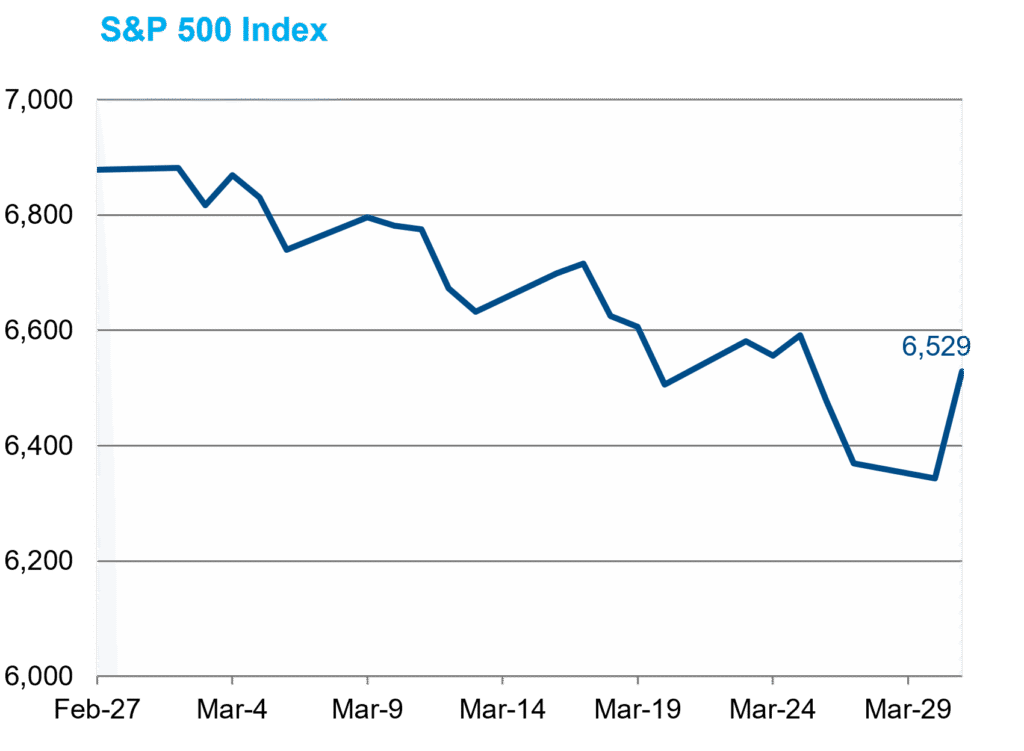
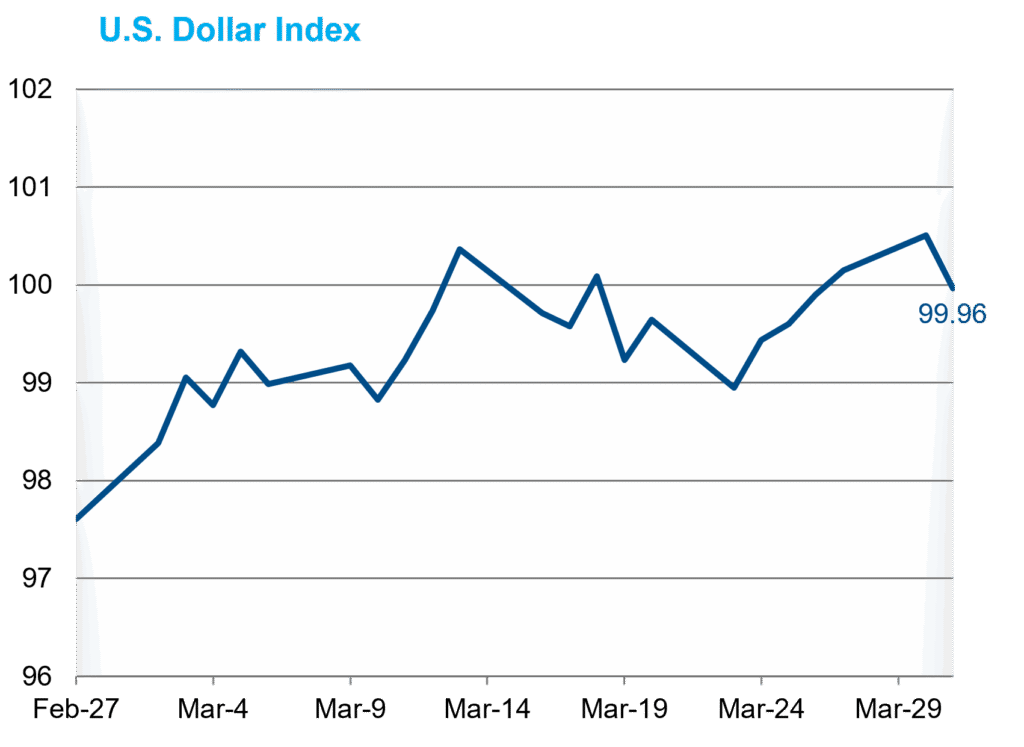
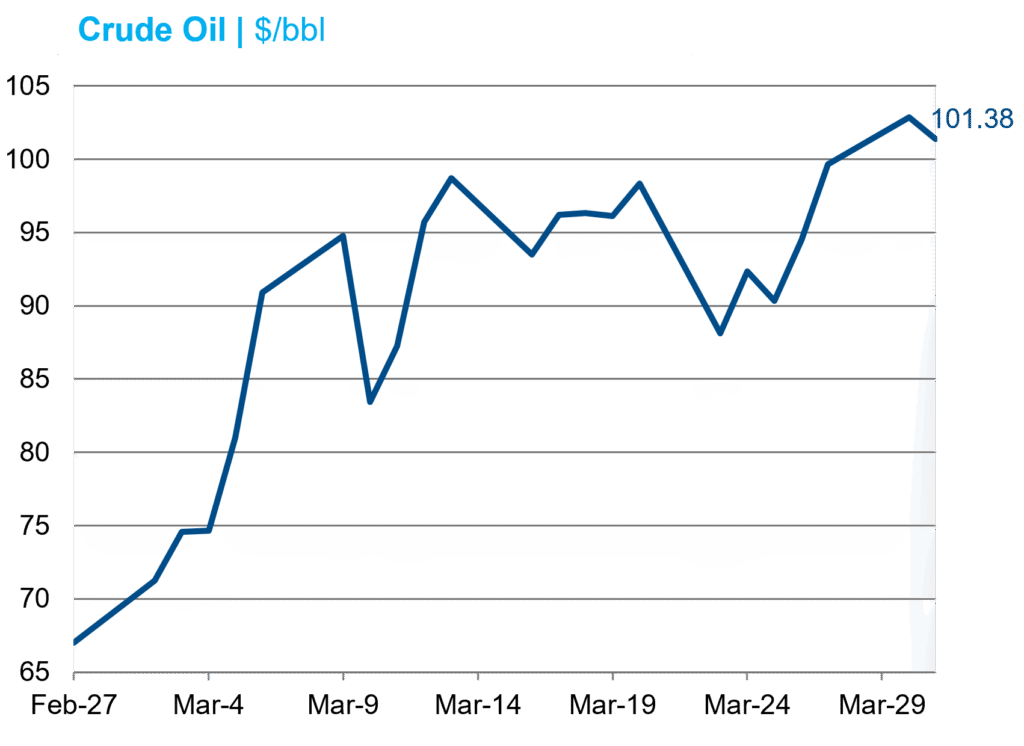
With headlines dominated by the Middle East conflict, equities and Treasuries declined, credit spreads widened, and oil soared.
Markets
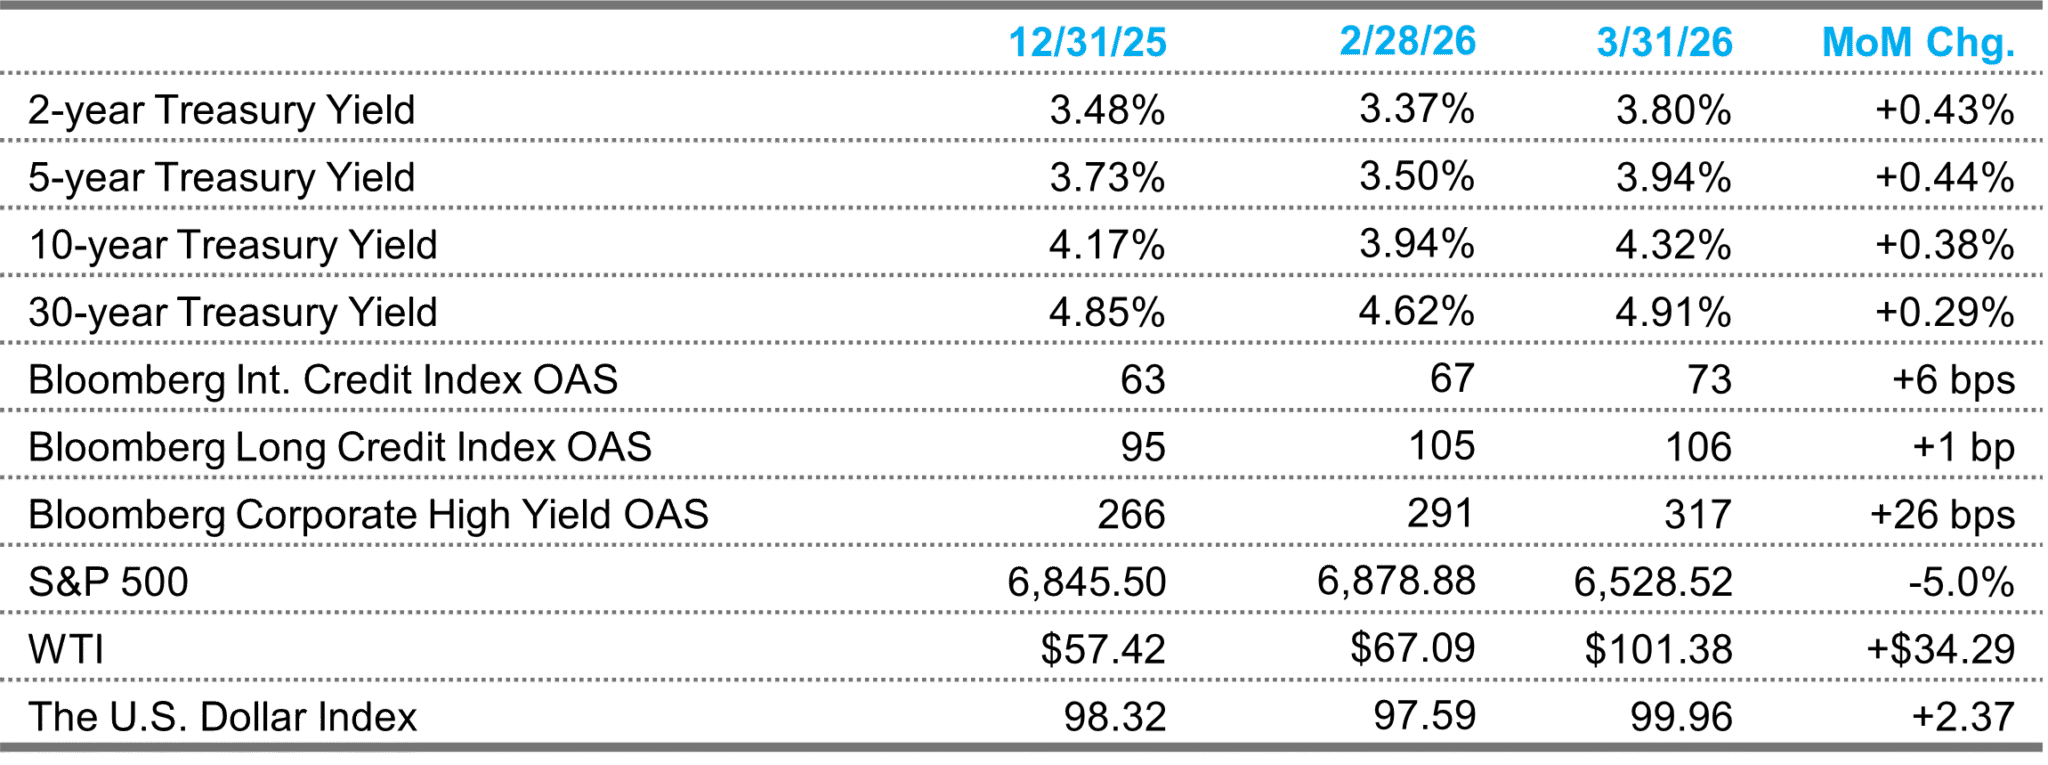
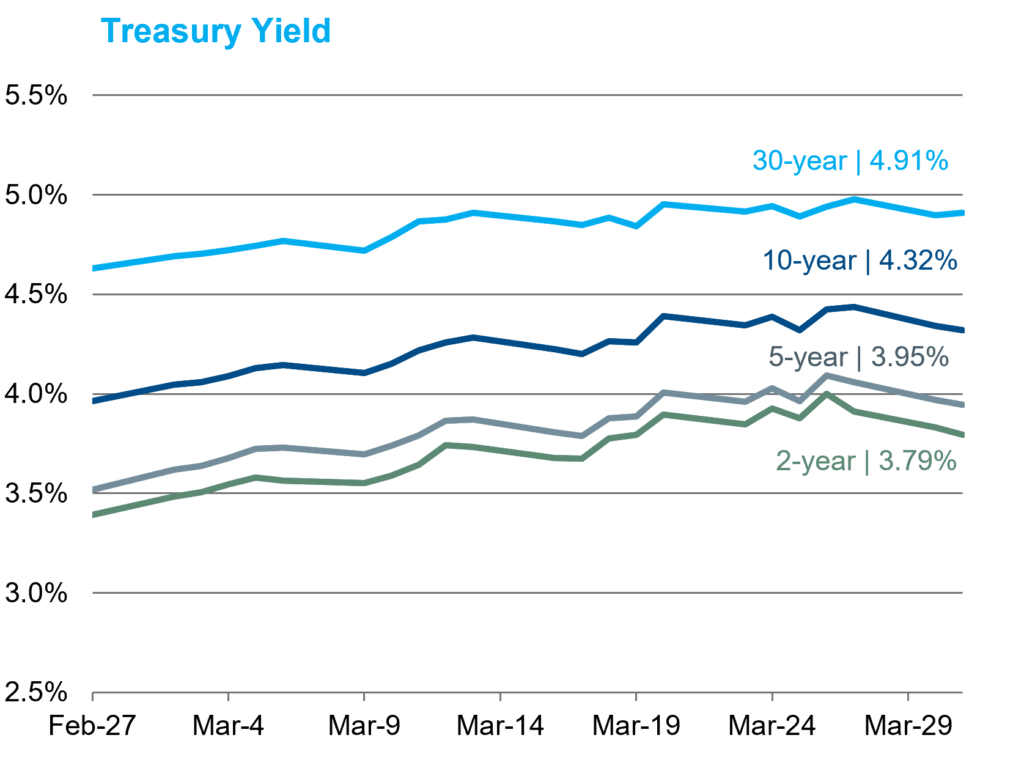
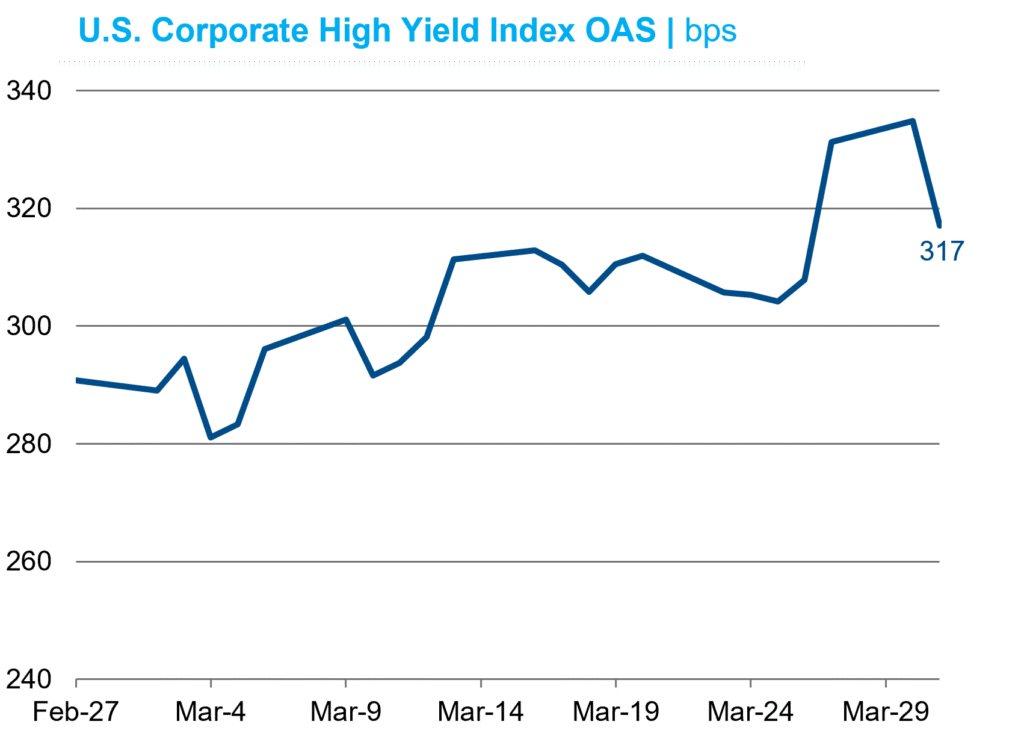
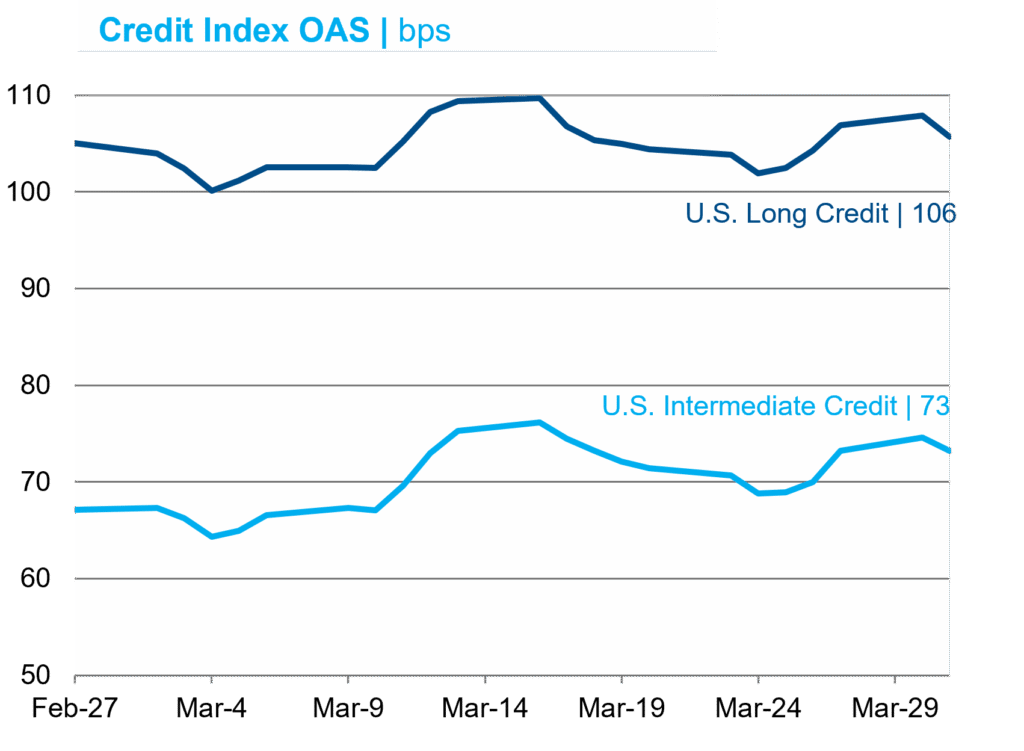
The S&P 500’s decline accelerated as March’s -5.0% return marked its worst month in exactly one year. Small caps experienced an eerily similar fate, with the Russell 2000 also falling 5.0%. Treasuries sold off, led by the front end, as higher near-term inflation expectations were priced in. In fact, the increase in the 2-year Treasury yield was identical to the increase in 2-year breakevens (see below), and the real yield was unchanged. Credit spreads widened but were relatively stable when compared to equities as opposing technical forces battled. Specifically, higher yields attracted demand, but mega deals from Salesforce and Amazon headlined a surge in supply. J.P. Morgan reported $235 billion in total investment-grade issuance, 40% over the average of the trailing four Marches. By contrast, high-yield issuance slowed, with just $21 billion for the month after $30 billion in February. The conflict in the Middle East sent oil skyrocketing, with WTI topping $100/bbl for the first time since the summer of 2022. The Dollar Index extended its monthly winning streak to two, and gold fell by 11.6%.
Economic Data
Nonfarm payrolls fell at a 92k pace in February, falling well short of consensus for a 55k increase. The release only included a 69k net reduction for the prior two months. The unemployment rate ticked up 0.1% to 4.4% despite a surprise 0.5% drop in the participation rate. Even after adjusting for distortions due to nursing strikes and cold weather, the report was weak overall. Nonetheless, retail sales were a touch stronger than expected in January and continued to strengthen in February. Consumer sentiment indices were mixed as the Conference Board reported an increase in March, while the University of Michigan’s declined. In manufacturing, sentiment surveys were weak on balance. Housing releases were mixed for the third straight month. As for economic growth, the second release of Q4 GDP was halved to 0.7%, driven largely by a downward revision in personal consumption from 2.4% to just 2.0%. As noted last month, the government shutdown dragged on government spending, which should produce a tailwind for Q1. The current consensus is for a rebound to around 3.0%.
Inflation
Headline CPI rose at a 0.3% MoM pace in February, while the core figure rose by just 0.2%. Both came in as expected. Housing inflation continued to decelerate, reaching its lowest monthly pace of the cycle at 2.26% annualized. PCE releases continued to come out behind schedule, but January figures were in line with surveys. Near-term inflation expectations followed oil prices much higher as 2-year breakevens rose 43 bps to 3.25%. Longer breakevens, on the other hand, barely budged.
Federal Reserve
The FOMC left policy unchanged at their March meeting, as expected. Chairman Powell was asked many questions about the monetary policy implications of the war in Iran and associated energy price shock, but he expressed a wait-and-see attitude about the uncertain future path of the war. The energy price shock represents a negative supply shock that will inject a stagflationary impulse into the U.S. economy. The key question for fixed income markets is whether the Fed’s reaction function is dominated by the upward pressure on inflation or the downward pressure on growth. Short rate markets have priced in the more hawkish response thus far, removing the two cuts that had previously been priced in by year end.
Sources: Bloomberg Index Services Ltd., Bloomberg.
This overview is for informational purposes only. The information has been obtained from sources considered to be reliable, but the accuracy and completeness are not guaranteed. There is no assurance that any economic trends mentioned will continue or that any forecasts will occur. Economic data are as of the dates noted.
Disclosure Information
By accepting this material, you acknowledge, understand and accept the following:
This material has been prepared by NISA Investment Advisors, LLC (“NISA”). This material is subject to change without notice. This document is for information and illustrative purposes only. It is not, and should not be regarded as “investment advice” or as a “recommendation” regarding a course of action, including without limitation as those terms are used in any applicable law or regulation. This information is provided with the understanding that with respect to the material provided herein (i) NISA is not acting in a fiduciary or advisory capacity under any contract with you, or any applicable law or regulation, (ii) that you will make your own independent decision with respect to any course of action in connection herewith, as to whether such course of action is appropriate or proper based on your own judgment and your specific circumstances and objectives, (iii) that you are capable of understanding and assessing the merits of a course of action and evaluating investment risks independently, and (iv) to the extent you are acting with respect to an ERISA plan, you are deemed to represent to NISA that you qualify and shall be treated as an independent fiduciary for purposes of applicable regulation. NISA does not purport to and does not, in any fashion, provide tax, accounting, actuarial, recordkeeping, legal, broker/dealer or any related services. You should consult your advisors with respect to these areas and the material presented herein. You may not rely on the material contained herein. NISA shall not have any liability for any damages of any kind whatsoever relating to this material. No part of this document may be reproduced in any manner, in whole or in part, without the written permission of NISA except for your internal use. This material is being provided to you at no cost and any fees paid by you to NISA are solely for the provision of investment management services pursuant to a written agreement. All of the foregoing statements apply regardless of (i) whether you now currently or may in the future become a client of NISA and (ii) the terms contained in any applicable investment management agreement or similar contract between you and NISA.